
When analyzing a company's financial health, one question often stands at the forefront: What are the three financial statements that comprehensively convey the complete narrative? While many focus on just one or two, understanding the connections between the Income Statement, Balance Sheet, and Cash Flow Statement is essential for a complete picture of a business's financial performance. These three key documents don't operate in isolation; instead, they are intricately linked, each feeding into and informing the others.
By grasping how they work together, you unlock the ability to read between the lines of financial data, revealing insights that go beyond what meets the eye. Whether you’re an analyst or looking to understand a company's true financial position and performance, this integrated approach is for you. Let’s explore how these three financial statements are interwoven and why their connections matter more than the statements themselves.
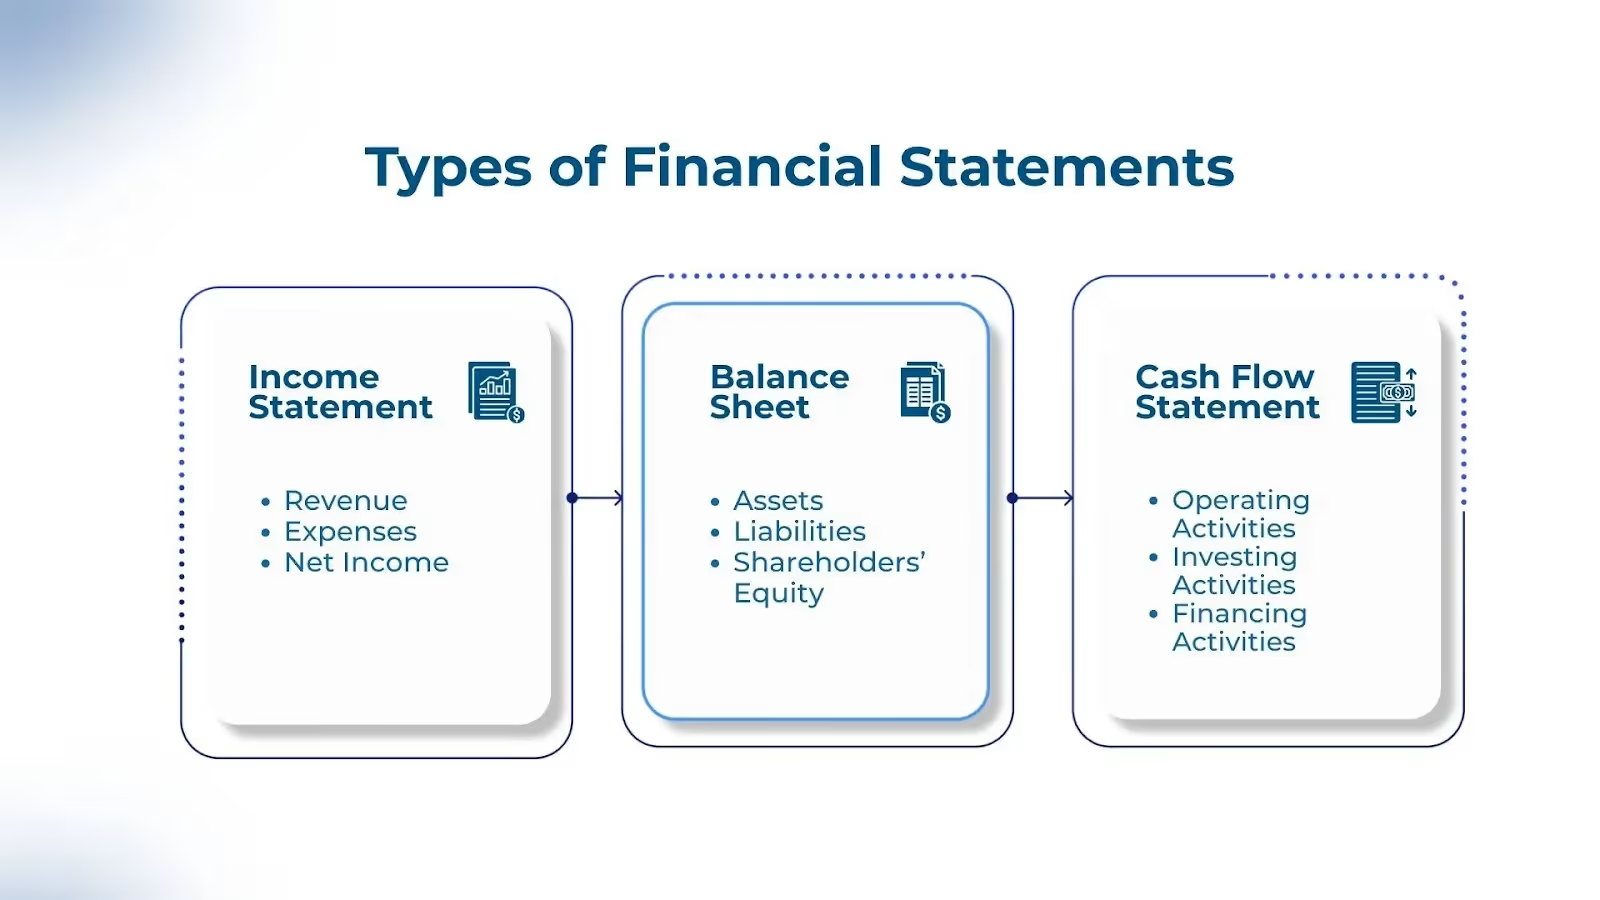
The three key financial statements are (1) the Income Statement, (2) the Balance Sheet, and (3) the Cash Flow Statement. These statements are essential for evaluating a company's financial performance and position. They provide a comprehensive snapshot of a business's financial health and are used by internal management and external stakeholders, such as investors, analysts, and creditors.
To better understand how each of these statements contributes to a company’s financial overview, let’s begin by taking a closer look at the Income Statement.
The Income Statement is like the report card for a company’s performance over a specific period. It shows whether a company is profitable by comparing its revenues to expenses. The statement outlines revenue, cost of goods sold, gross profit, operating expenses, and net income. These components tell a clear story of how much money came in and how much was spent, leading to either a profit or a loss.
For example, imagine a business selling products. The revenue comes from sales, but the company incurs costs (e.g., raw materials and labor) to make these products. These costs are subtracted to find the gross profit. After that, the company subtracts its operating expenses (like rent and salaries), and what’s left is the net income, which shows the final profit or loss.
The Income Statement follows accrual accounting rules. This means it doesn’t wait for cash to change hands; it records revenue when earned and expenses when incurred, making it different from the cash flow statement. The net income from this statement connects directly to both the Balance Sheet and the Cash Flow Statement. It affects retained earnings in the Balance Sheet and is the starting point in the Cash Flow Statement.
Now that we’ve looked at how a company earns and spends, let’s take a step back and see the bigger picture through the Balance Sheet.
The Balance Sheet is a snapshot of a company’s financial health at a specific time. It’s divided into three key sections: assets, liabilities, and shareholders' equity. These components offer a clear picture of what a company owns, what it owes, and the value left for its shareholders.
At the core of the Balance Sheet is the accounting equation: Assets = Liabilities + Equity. This simple but powerful formula ensures that the balance sheet "balances." On one side, you have everything the company owns (assets), and on the other, you have how it financed those assets through debt (liabilities) or the owners' contributions (equity).
The purpose of the Balance Sheet is to provide an overview of the company’s financial position. This includes its ability to meet short-term obligations, invest in growth, and generate profits. For example, if a company’s assets outweigh its liabilities, it’s in a healthy position. But if liabilities are high, it could signal financial strain.
Changes in assets and liabilities directly affect other financial statements, particularly the Income Statement and Cash Flow Statement. For instance, when a company takes on more debt, it may affect its net income and cash flow due to interest payments. Similarly, asset changes, like increasing inventory, could affect cash flow.
It’s time to explore how cash actually moves in and out of the business with the Cash Flow Statement.
The Cash Flow Statement is crucial for assessing a company's liquidity and financial flexibility. Unlike the Income Statement, which includes non-cash items, the Cash Flow Statement focuses solely on actual cash inflows and outflows during a period. It categorizes these cash flows into three main sections: operating activities, investing activities, and financing activities.
Starting with net income from the Income Statement, the Cash Flow Statement adjusts for non-cash items, such as depreciation, and changes in working capital, which are reflected in the Balance Sheet. This approach ensures the statement accurately portrays the company’s actual cash movements, giving an accurate picture of its liquidity.
Having explored the Cash Flow Statement, it's time to compare all three financial statements to see how they work together to provide a complete picture of a company’s financial health.
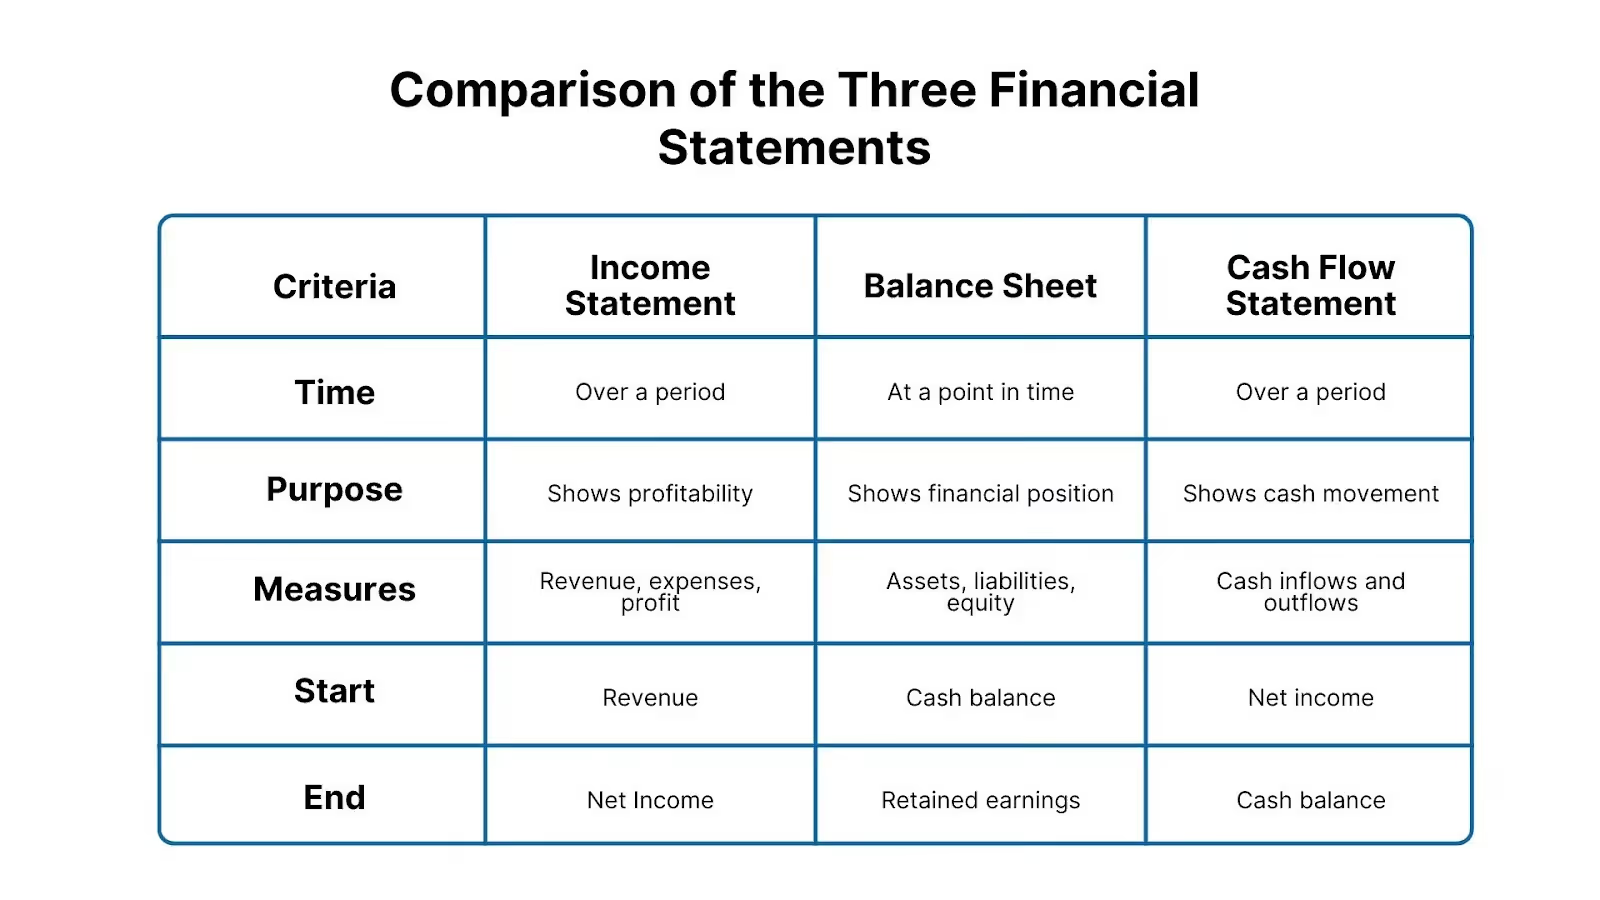
After comparing the three financial statements, let's examine how they relate to one another and function as a whole to present a comprehensive financial picture.
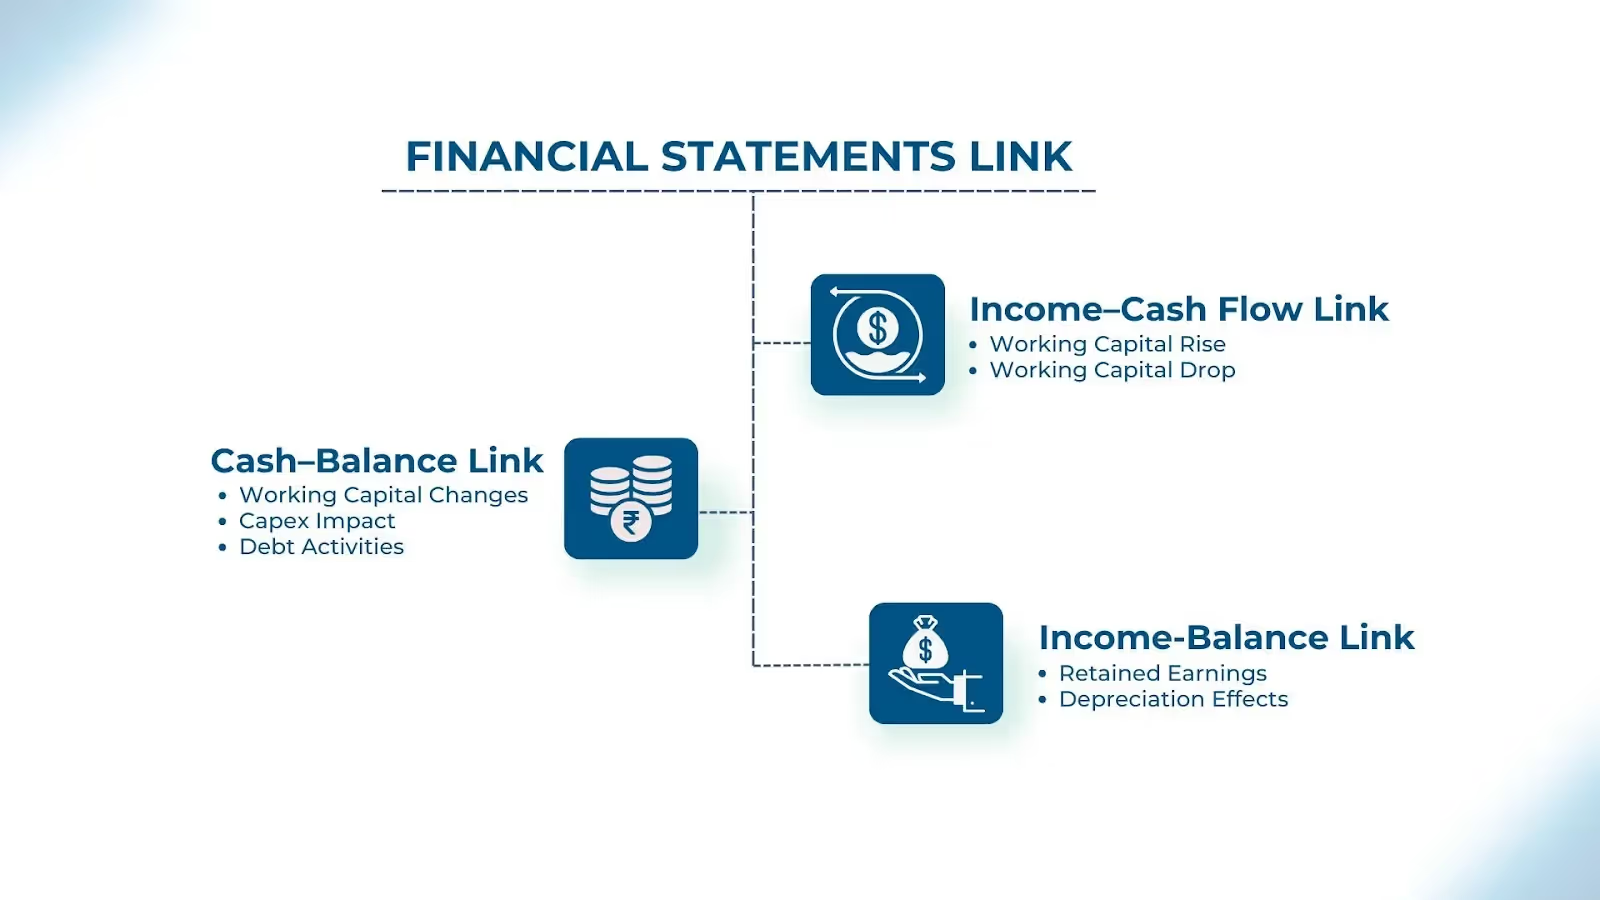
损益表、资产负债表和现金流量表均基于权责发生制原则,这使得它们之间形成了紧密的联系。每张报表都提供了有价值的信息,而它们之间的相互作用则能全面反映公司的经营业绩和财务状况。以下是各报表间的关联方式:
损益表和现金流量表通过净利润直接关联。损益表底部的净利润是现金流量表的起点。
在此基础上,现金流量表会对折旧和摊销(D&A)等非现金项目进行调整,这些费用虽然减少了净利润,但并不影响现金流。此外,它还会核算营运资金的变化,例如应收账款或存货的增加,这些变化代表了现金的流出或流入。
例如:
通过对这些项目进行调整,现金流量表能够准确反映公司在特定时期内实际产生或使用的现金,从而弥补了损益表中 权责发生制 会计处理带来的差异。
现金流量表和资产负债表通过营运资金变动、资本支出(Capex)和融资活动紧密相连。具体关联方式如下:
损益表和资产负债表主要通过留存收益进行关联。这种关联的工作原理如下:
留存收益的计算公式为:
留存收益 = 期初余额 + 净利润 – 股息
如果公司盈利,留存收益会增加,从而提高股东权益;如果公司亏损,留存收益则会减少。
在了解了三大财务报表如何关联后,让我们来看看这些核心报表在财务建模中是如何运用的。
财务建模的核心在于预测公司的未来表现。你必须整合损益表、资产负债表和现金流量表,才能构建出准确的模型。这三张财务报表协同工作,为任何财务模型提供了完整的框架。
财务建模的第一步是为三大财务报表中的每一项创建明细科目。这些科目是模型的基础。在搭建好结构后,您需要核对所有报表中的数据,以确保其一致性。
例如,损益表中的净利润应与现金流量表的起始余额相符,而现金流量表中的期末现金余额必须与资产负债表中的现金数额一致。
一旦报表对齐,即可根据历史数据准备假设条件。这些假设有助于预测未来的业绩表现。
预测是财务建模的核心。通过分析三大报表的历史趋势,您可以预判未来的经济成果。例如,如果销售额每年保持 10% 的稳定增长,您就可以使用相同的增长率来预测未来的销售收入。同样,稳定的运营费用也可以根据过往趋势进行预测。
现金流量表发挥着关键作用,尤其是在了解营运资本和资本支出的变化如何影响现金流方面。这对于评估公司是否有足够的现金来履行义务并推动未来增长至关重要。
构建详细模型通常需要针对更复杂的项目编制辅助明细表。例如:
理解三大财务报表看似复杂,但其实并不令人望而生畏。只要牢固掌握它们之间的内在联系,企业就能做出更明智的财务决策,确保未来增长之路更加清晰。每张报表都提供独特的见解,而将它们结合起来,就能全面呈现公司的业绩表现和财务健康状况。
保持准确的财务记录并定期进行审查,有助于企业预防错误并预见挑战。如果您的企业在构建或解读这些财务报表时需要专业指导,VJM Global随时为您提供帮助。
我们的团队提供专业的财务建模支持,确保其符合行业标准,并为您提供做出明智决策所需的洞察。 欢迎联系我们获取个性化协助。我们致力于引导您理清财务分析的复杂细节,让您能够专注于真正重要的事情。