%20(12).webp)
制造业的生死存亡取决于准确的成本数据。2025 年 7 月,美国制造商举行了大约 9520 亿美元 在总库存中,如果成本记录不佳或估值不佳,该水平可能会波动利润率。在同一季度,制造业的单位劳动力成本 上涨 2.0%,提醒财务团队,车间的微小变化很快就会出现在损益表中。
成本核算、库存估值以及核对 COGM 和 COGS 的清晰方法将这幅动态画面变成了您可以信赖的决策。如果您的足迹遍布美国和印度,那么一致的政策和共同的定义就显得尤为重要,因为不同的标准和货币会发挥作用。
在本博客中,我们将详细探讨制造商会计、它涉及的内容、关键成本组成部分以及如何计算关键指标,例如制造成本(COGM)和销售成本(COGS)。
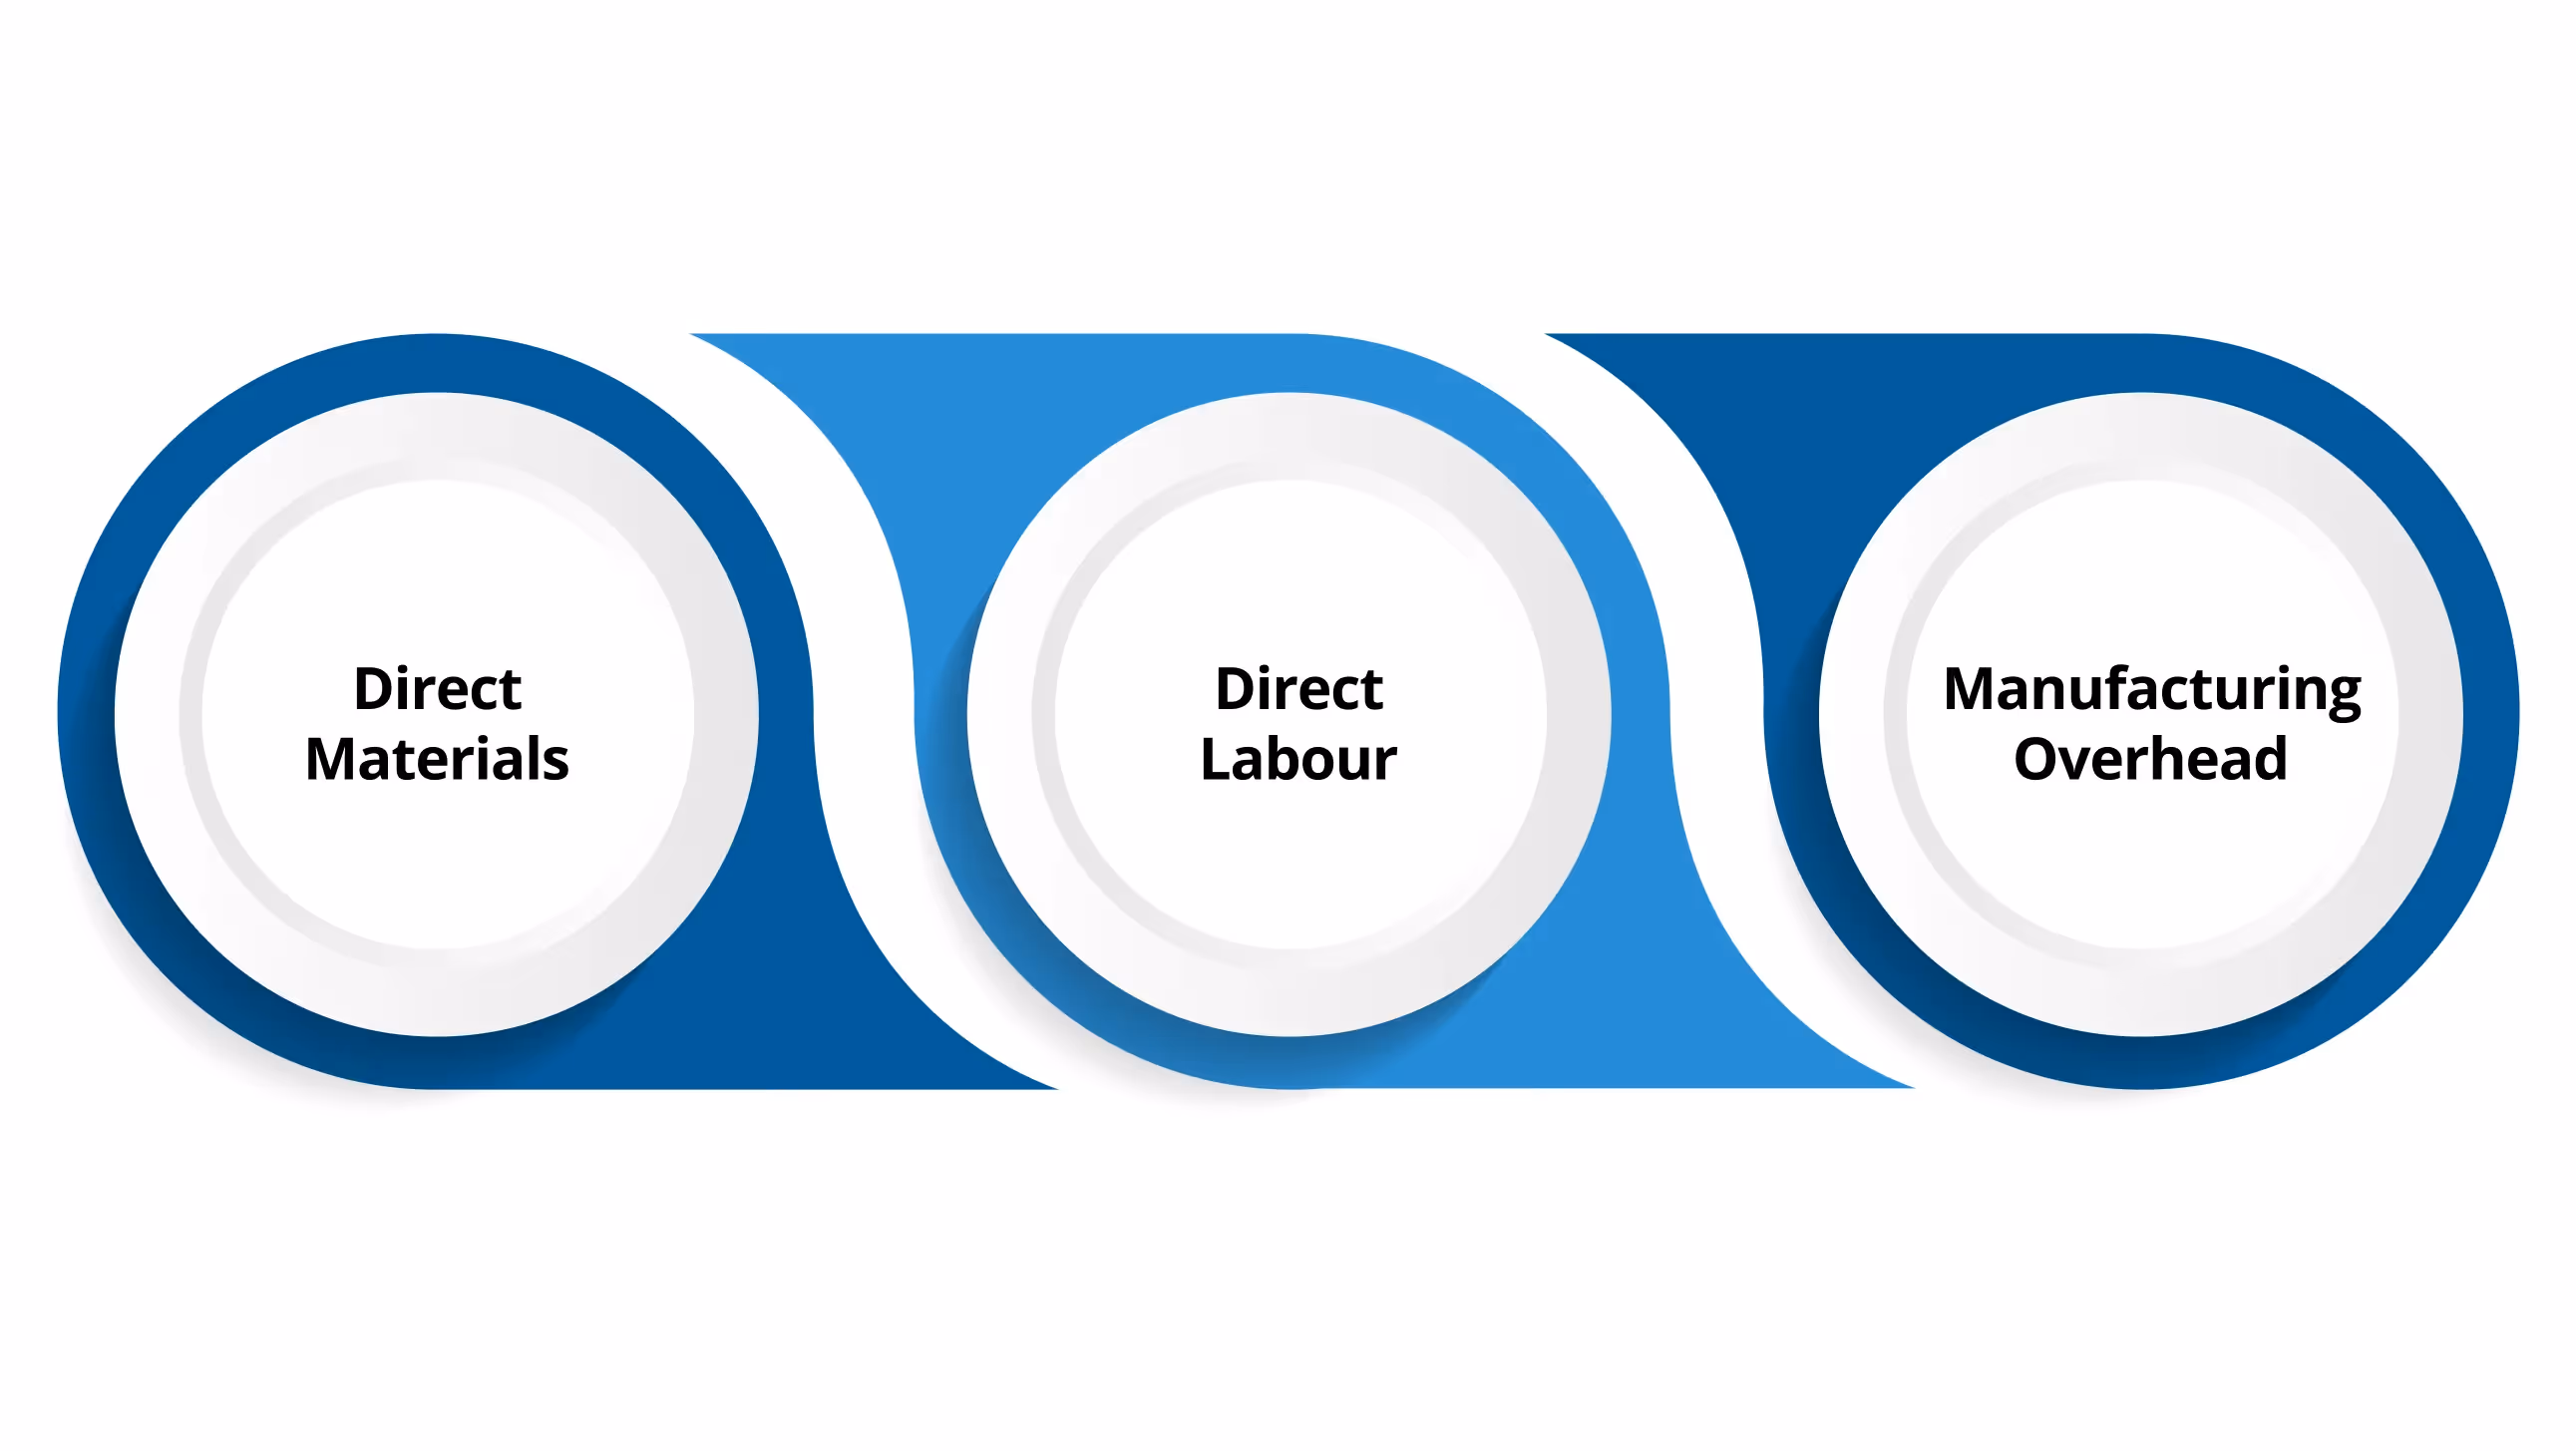
制造业会计是成本和管理会计的一个专业分支,处理生产实物商品所产生的所有成本。它跟踪直接材料、直接劳动力和制造开销,将这些成本分配给生产单位,并帮助对期末库存和COGS进行估值。
与一般财务会计不同,制造业会计严格关注生产过程并支持内部决策,尽管其许多产出也影响外部财务报表和监管披露。
一旦你了解了制造业会计的涵盖范围,下一步就是研究不同的会计类型,这些会计类型相互配合,以保持工厂财务的准确和透明。

制造业混合使用从车间到财务报表的会计学科。每个人都回答了一个不同的问题:生产成本是多少,我们应该如何估值库存,以及领导者接下来应该做出哪些改变以提高利润。
这对于外部报告来说是第一位的。美国制造商遵循美国公认会计原则,而印度实体遵循基于国际财务报告准则的Ind AS。
在这两种情况下,库存均按成本记账,然后根据可变现净值进行测试。美国公认会计原则允许使用FIFO、加权平均值和LIFO等方法。国际财务报告准则和印度会计准则禁止LIFO,因此跨境团体从美国到印度工作时必须谨慎选择方法。
这种类型将生产活动转化为资产负债表和销售商品成本的数字。公司通常使用FIFO或加权平均成本。国际财务报告准则和印度会计准则要求较低的成本和净可实现价值模型。
美国公认会计原则使用类似的模型,但在使用LIFO或零售方法时采用不同的 “市场” 测试。这些规则影响利润率和税收,因此美国和印度账簿的一致性很重要。
成本会计是机房。它捕获直接材料、直接劳动力和制造开销,并将其分配给生产单位。制造商根据他们的制造方式来选择方法。任务成本符合定制订单和短期任务。流程成本与连续、均匀的产出相适应。
许多工厂还使用标准成本和方差分析来发现目标结果和实际结果之间的差距。基于活动的成本核算有助于使用实际成本驱动因素而不是广泛的平均值来分摊管理费用。
外部财务报表需要这种成本核算。它将所有制造成本计入库存,包括固定的工厂管理费用。这使报告保持可比性,并将销售商品时的成本与收入挂钩。管理人员经常在内部审查可变成本,以更清楚地了解缴款利润率和短期决策,但他们仍会发布基于吸收的结果。
管理层将上述内容纳入计划和决策。团队使用成本和库存数据来设定价格、预算材料和劳动力、监控产能并评估产品线的盈利能力。
当一家公司从美国到印度开展业务时,管理报告还会调和GAAP、IFRS和Ind AS之间的方法差异,因此领导者对单位成本、利润率和股票现金的真实情况有一个看法。
总而言之,这些学科可以让制造商全面了解绩效。财务会计使您保持合规。库存和吸收规则使报表保持一致。成本和管理工具可帮助您减少浪费,自信地设定价格,并在减少意外的情况下计划生产。
VJM Global 带来美国公认会计原则、国际财务报告准则和印度会计准则方面的专业知识,帮助跨境制造商在两个司法管辖区保持成本报告和财务合规的一致性。
这些会计类型中的每一种在衡量生产绩效中都起着作用。但是,在计算利润或对库存进行估值之前,我们需要了解组成部分:构成总制造支出的主要成本组成部分。
制造业依赖多种会计学科,这些学科共同作用,将车间活动转化为清晰的财务见解。以下是核心类型及其适用方式:
这三者加在一起通常被称为产品成本,因为它们被资本化为库存,然后在您出售商品时流入COGS。销售和管理成本不在生产范围内,被视为期间成本,在发生期间记作支出。保持产品成本和周期成本之间的界限是保护报告利润的基本控制措施。
您还将听到两个有用的摘要:
随着产出的上升或下降,成本的行为会有所不同,因此按行为对它们进行分组很有帮助:
最后,将成本与货物的流动位置挂钩。原材料等待使用,在建工程 (WIP) 存放部分完工的物品,运送材料、人工和管理费用,制成品已做好销售准备。这些阶段之间的准确变动可保持资产负债表整洁,COGS值得信赖。
如果您的业务从美国运营到印度,请调整双方的定义和估值规则,以使报告相符,决策保持一致。
建议阅读: 如何申请制造业研发税收抵免:从美国外包到印度
当这些成本得到正确识别和分组后,制造商可以将其转化为可衡量的产出。下一个合乎逻辑的步骤是通过计算制造产品的成本和销售商品的成本,来了解这些成本如何流经从原材料到成品的生产过程。
对于制造商而言,了解两个关键数据,即商品制造成本(COGM)和销售成本(COGS)至关重要。这些数字将生产车间发生的情况与您的财务报表联系起来,如果您的业务跨越从美国到印度的地理位置,这些数字尤其重要。
COGM 记录了一段时间内生产制成品所产生的总成本,无论这些商品是否已售出。它将直接材料、直接劳动力和制造开销捆绑在一起,增加了期初在产 (WIP) 库存,并减去期末的在建库存。
标准公式是:
COGM = 期初 WIP 库存 + 总制造成本 — 期末 WIP 库存
其中,总制造成本 = 直接材料 + 直接人工 + 制造费用。
它为何重要:
COGS 反映了制成品的成本 被卖了 在此期间。它将制造成本与收入联系起来,直接出现在损益表上。
制造商的典型公式是:
COGS = 期初成品库存 + COGM — 期末成品库存
这与更广泛的库存流视角一致:期初库存加上制造的库存(COGM)提供可供出售的商品;减去期末库存即可获得实际销售的货物。
它为何重要:
要有效地计算这些值,你需要:
另请阅读: 了解公认会计准则与非公认会计准则毛利率:公司为何从美国外包到印度
了解您的COGM和COGS可以让您清楚地了解盈利能力。但是,在此过程中如何为库存分配价值可能会显著改变这些结果。这就是为什么下一节重点介绍库存成本计算方法以及如何为您的业务选择合适的方法的原因。
库存是任何制造企业的心跳。您的估值方式决定了您的商品销售成本(COGS)、毛利,并最终决定资产负债表的健康状况:
FIFO 假设最早的库存物品先出售。旧材料的成本转移到COGS,而新购买的材料仍保留在期末库存中。在材料价格上涨时期,FIFO显示出更低的COGS和更高的利润,因为更便宜、更早的成本与当前的销售相匹配。它在美国公认会计原则和印度会计准则/国际财务报告准则中都被广泛接受,使其成为在这两个市场上运营的制造商的实际选择。
LIFO 假设最近购买的商品首先售出。它将当前成本与当前收入相匹配,并且可以在价格上涨时减少应纳税所得额。但是,美国公认会计原则允许LIFO,但IFRS和Ind AS禁止后进先出,因此从美国到印度的跨国制造商必须保持美国的LIFO账面与印度的FIFO或加权平均账面之间的对账。
加权平均法通过将可供销售商品的总成本与总单位的平均值来平滑价格波动。库存中的每个单位的平均成本相同。它易于在自动化系统中维护,并被美国公认会计准则和印度会计准则/国际财务报告准则所接受。许多印度制造商更喜欢这种方法,因为当原材料价格经常变化时,这种方法具有稳定性。
这种方法可以追踪每件独特物品的确切成本,使其适用于高价值或定制的商品,例如机械或豪华部件。它提供了最精确的成本和收入匹配,但需要详细的跟踪,很少用于大批量制造。
标准成本计算设定了预先确定的材料、人工和间接费用成本,并将差异记录为差异。它通常与其他内部控制和绩效监控方法结合使用。差异,无论是有利还是不利,都有助于管理人员评估效率并采取纠正措施。
ABC 使用实际活动、机器工时、质量检查或批次设置来分配管理费用,而不是粗略的平均值。它可以更清楚地了解真实的生产成本,尤其是在复杂或多产品环境中。对于从美国到印度的跨境制造商,ABC通过将成本与特定的运营驱动因素联系起来,支持更好的转让定价文件。
最佳的成本核算方法取决于您的生产类型、价格波动和报告义务。一家在印度制造的美国公司可能会在印度账簿中维持FIFO或加权平均值,以符合Ind AS的要求,同时出于美国税收目的保留LIFO。一致性和披露是关键。在报告合并业绩时,调整可确保库存估值与集团政策保持一致。
在VJM Global,我们建议制造商选择和应用正确的库存成本核算方法,无论是FIFO、加权平均还是标准成本核算,以保持各实体的估值一致和透明。
成本核算只是财务状况的一部分。为了将成本数据转化为决策,制造商需要将产量、数量和盈利能力联系起来的工具,这使我们得以进行成本量利润(CVP)分析以及它对战略规划的重要性。
成本量利润(CVP)分析是了解成本、销售量和利润如何相互关系的一种简单而有效的方法。它可以帮助制造商回答商业中最实用的问题之一: 我们需要出售多少单位来支付成本,之后我们将获得多少利润?
公式很简单:
盈亏平衡点(单位)= 固定成本 ÷(单位销售价格 — 单位可变成本)
一旦你越过这个点,每多卖出一个单位,利润就会增加贡献幅度。
无论是自动化流程、外包组件还是扩大产能,制造商经常面临权衡取舍。CVP 分析重点介绍了每项决策如何改变成本组合。例如,自动化可能会增加固定成本,但会降低单位可变成本,从而改变盈亏平衡点。它还有助于预测货币变动或原材料波动对从美国到印度运营的公司的影响。
经理使用 CVP 模型来:
虽然CVP分析有助于指导决策,但健全的会计惯例可确保整个系统的可靠性。最后,让我们回顾一下加强制造业会计和保持不同地区运营一致性的最佳实践。
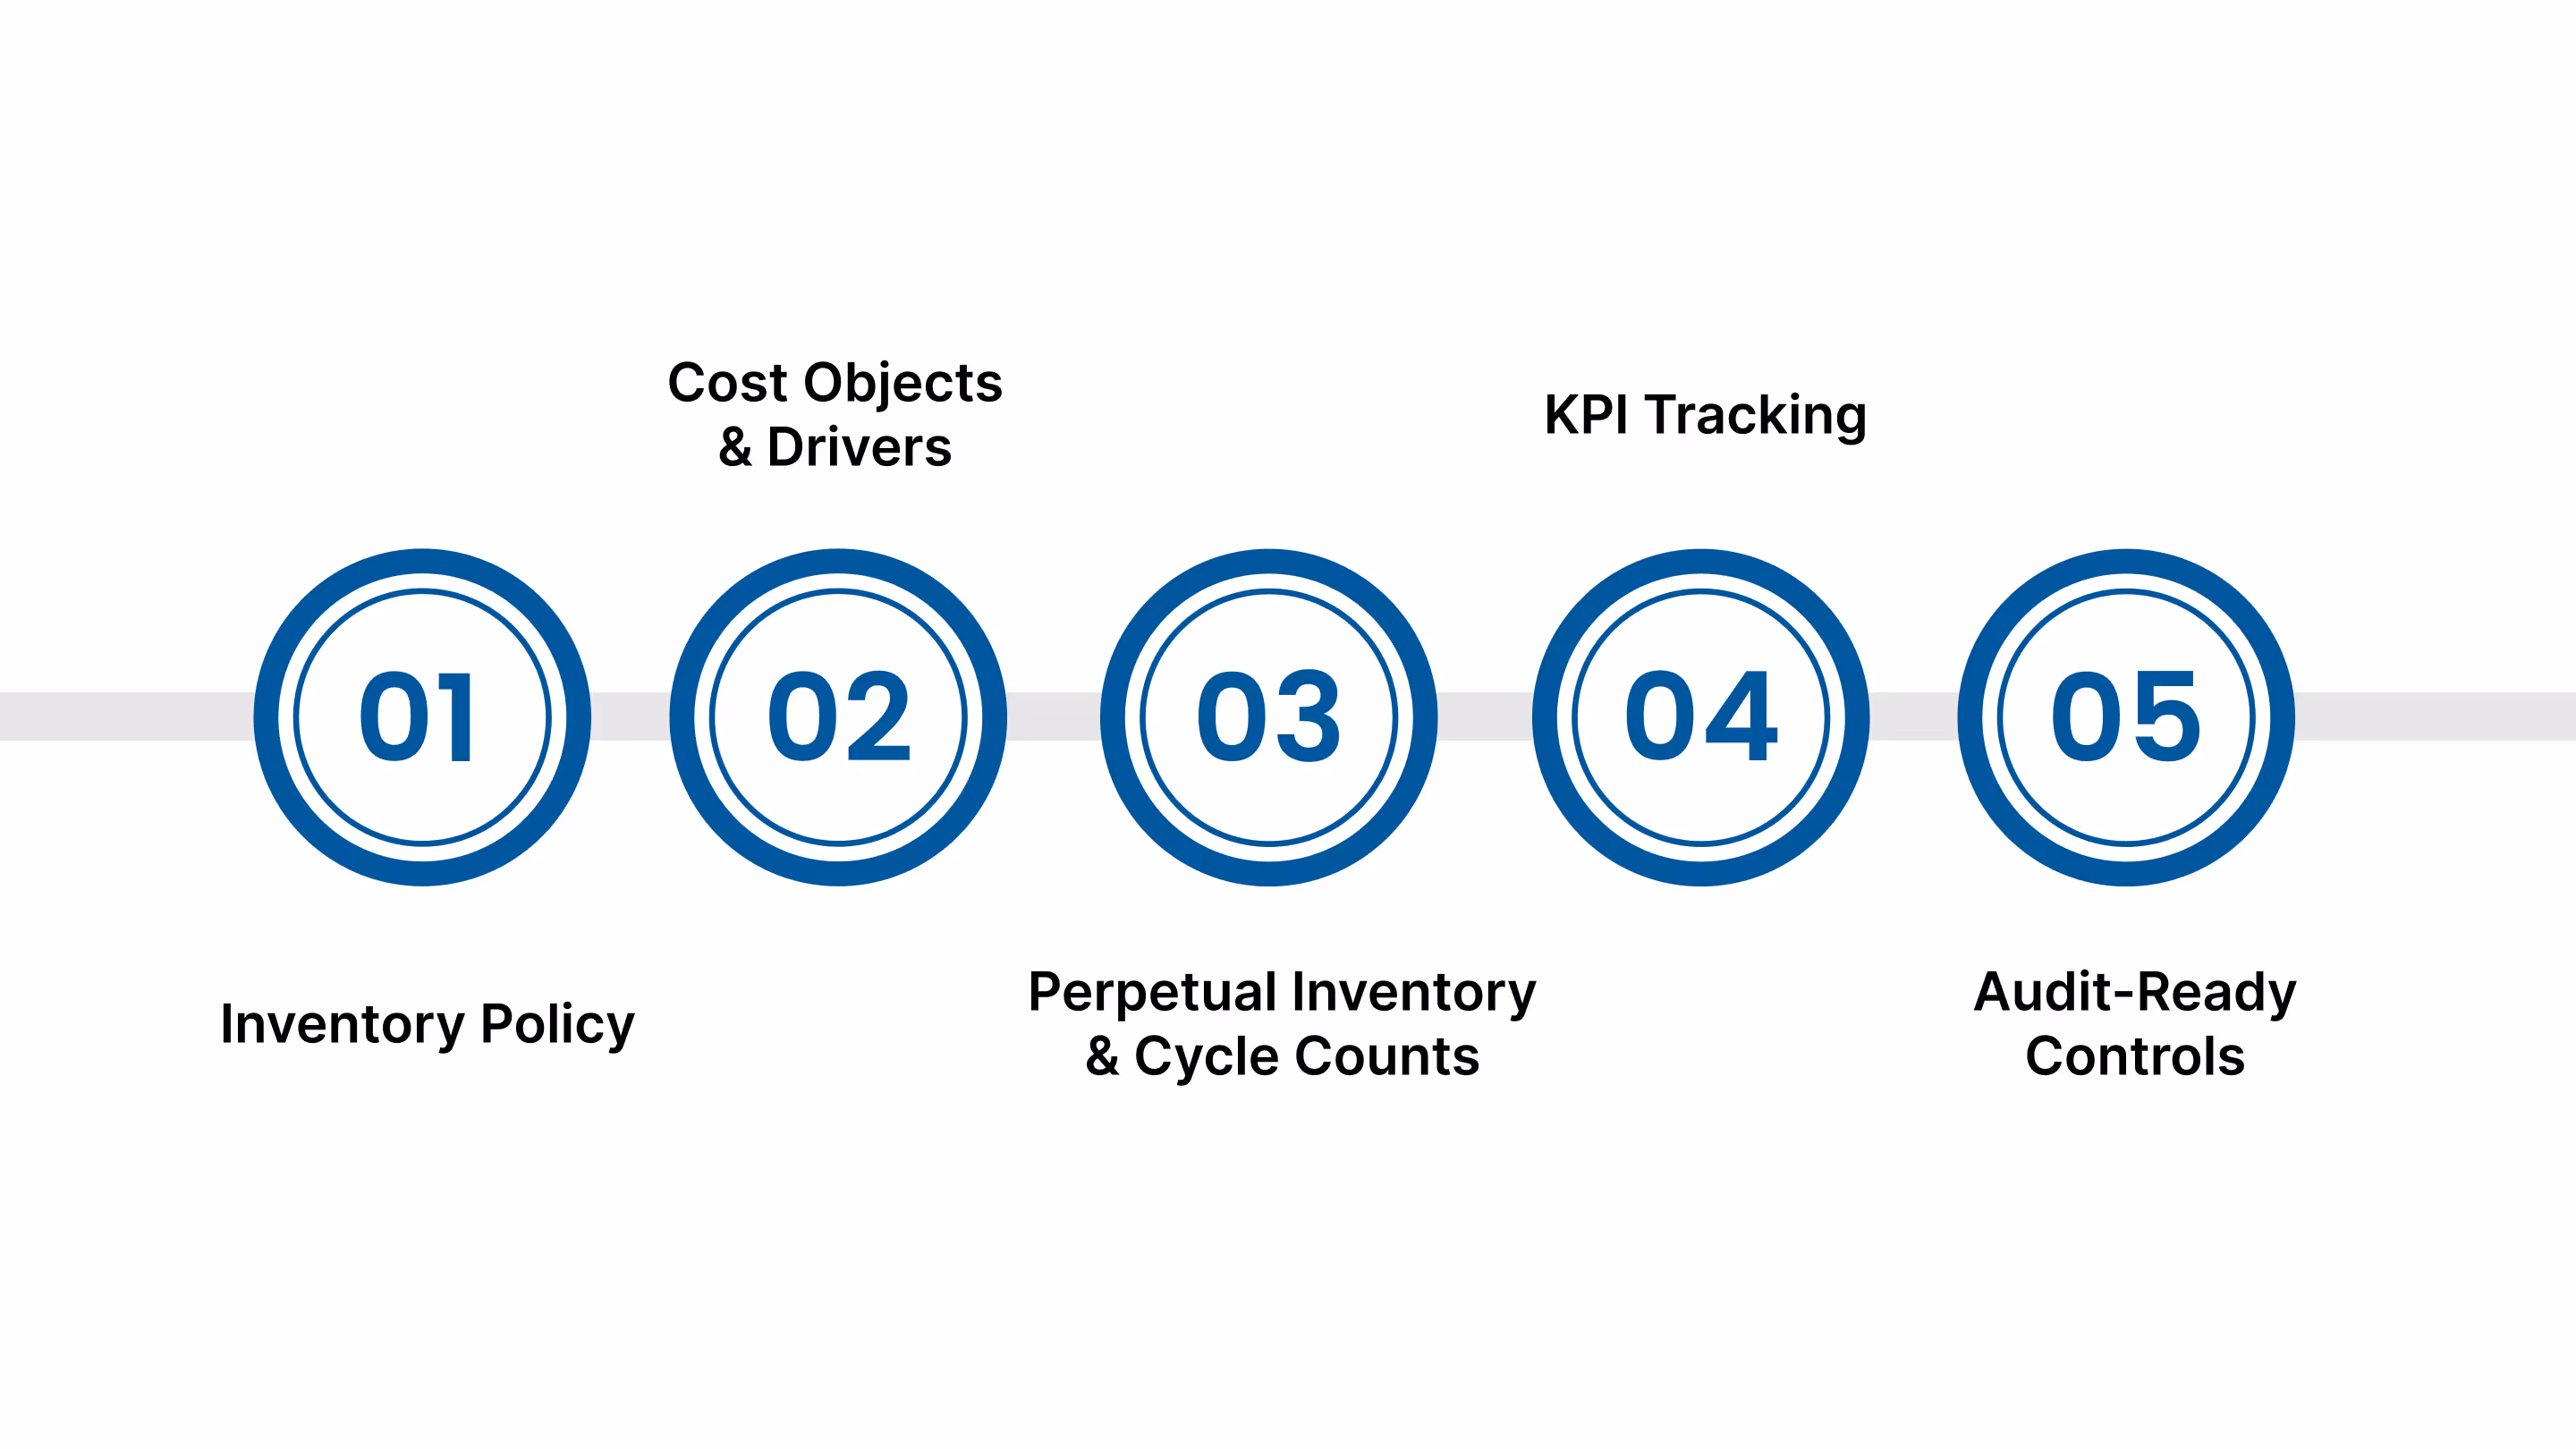
强大的制造业会计从您每月遵循的简单规则开始。目标是在定价、规划和审计方面提供值得信赖的明确数字,特别是如果您的业务从美国延伸到印度。
选择您的成本公式和估值规则,将其写下来,并在每个时期以相同的方式应用它们。根据国际财务报告准则/IND AS,库存以较低的成本和净可变现价值来衡量。
根据美国公认会计原则,大多数库存是以较低的成本或市场来衡量的,对于许多实体而言,根据最近的指导,以成本和自然资源价值的较低者来衡量。如果您的美国账簿使用LIFO,而印度使用FIFO或加权平均值,请建立对账以保持小组结果的一致性。
确定您的成本、产品、批次、生产线或客户,并选择反映实际工作的驱动因素,例如机器工时或设置。
当管理费用是材料或产品的资源消耗方式存在很大差异时,可以考虑基于活动的成本核算。记录模型,以便工厂、财务和审计团队使用相同的地图。
对于快速移动的工厂来说,每年一次的实物清点是不够的。使用周期盘点来经常测试一小部分库存,调和差异并修复根本原因。
永久系统加上周期计数可提高记录准确性并支持可靠的财务报告。政府和行业指南将周期计数视为控制和效率的主要做法。
监控原材料、WIP 和制成品的库存周转率。使用趋势来发现移动缓慢的项目、瓶颈或数据问题。营业额是一个简单的比率,但它是库存现金和COGS准确性的最佳信号之一。
限制谁可以添加项目、更改成本或后期调整。单独负责采购、接收和录音。将这些控制措施映射到 COSO 框架,这样您就可以向管理层和审计人员展示如何在日常工作中应对风险。
维护物料清单、路线标准、差异分析、开销池和带有签核的计数表。如果服务提供商处理会计任务,请索取相关的 SOC 鉴证报告,以了解他们的控制情况。
创建月度清单,从车间数据清晰地转移到账本中:材料问题、劳动力采集、管理费用申请、WIP 向前滚动、COGM 和 COGS 计算,然后与库存子账本的对账。
如果您从美国到印度开展业务,请包括货币折算步骤以及保单中提及的任何 GAAP 与 Ind AS 差异的长期对账。
良好的制造业会计可以做三件事。它显示了每个单位的实际成本,保持了库存价值的可信度,并帮助领导者选择需要改进的地方。您选择的成本计算和库存方法以及月复一月地应用这些方法的方式,将影响定价、容量计划和毛利率。当工厂、供应商或财务团队位于不同的国家时,对共同规则和干净移交的需求就会增加。这样,您就可以避免近期出现意外情况并保持现金、成本和产出平衡。
如果您想要一个了解工厂车间成本会计和合并时法定报告的合作伙伴,请联系 VJM Global。我们的团队支持库存估值、COGM 和 COGS 构建、审计就绪工作文件和跨境报告,包括从美国到印度的项目。
立即联系我们 讨论您的流程并获得适合您的系统和截止日期的实用计划!
大多数制造商每季度或每半年审查一次标准成本,但大批量工厂通常每月重新检查材料和人工费率,以及时了解价格和效率的变化。
现代 ERP
系统集成了生产数据、库存跟踪和会计模块,从而减少了人为错误并确保了各部门的实时成本可见性。
间接费用分配不当会扭曲产品成本、错误陈述库存价值并导致定价错误。定期进行方差分析和定期重新校准成本驱动因素有助于防止出现此问题。
它提供了对成本行为、产品盈利能力和容量使用情况的见解,这些信息可帮助经理决定定价、流程改进和投资优先事项。