
Introduction: What Are Accounting Ratios and Why Do UK Businesses Need Them?
Accounting ratios are calculations derived from your profit and loss account and balance sheet, translating raw financial data into measurable insights about profitability, liquidity, and operational efficiency. For the 5.5 million SMEs across the UK — representing 99.8% of the total business population — they turn numbers into decisions.
UK businesses rely on these metrics to:
- Track performance across reporting periods
- Benchmark against industry peers
- Spot early warning signs of financial stress
- Present a credible picture to lenders, investors, and HMRC
Whether you're preparing for a bank loan, reviewing quarterly results, or planning for growth, ratios give decision-makers the objective evidence they need.
This guide covers four main categories: profitability, liquidity, efficiency, and solvency/gearing. Monitoring these regularly sharpens financial decision-making and helps you catch problems early.
TLDR
- Accounting ratios fall into four categories — profitability, liquidity, efficiency, and solvency — each revealing a different dimension of financial health
- Track ratios over time and compare against UK industry benchmarks — never interpret them in isolation
- UK banks and lenders routinely assess gearing, interest cover, current ratio, and ROCE when evaluating creditworthiness
- Start with gross profit margin, net profit margin, current ratio, debtor days, and gearing ratio
- Historical data and business context both matter when drawing conclusions from any ratio
Profitability Ratios: How Well Is Your Business Generating Returns?
Gross Profit Margin
Gross profit margin measures the relationship between revenue and the direct costs of producing goods or services. The formula is straightforward:
Gross Profit ÷ Revenue × 100
A declining gross margin signals rising direct costs — materials, labour, or production expenses — or pricing pressure from competitors. According to ONS data, UK manufacturing businesses reported an 11.8% net rate of return in Q2 2025, while services businesses achieved 15.2%.
Your gross margin reveals whether your core business model is sustainable before accounting for overheads. If this number drops quarter-on-quarter, investigate supplier costs, production efficiency, or pricing strategy.
Net Profit Margin
Net profit margin accounts for all expenses — rent, utilities, wages, admin costs, and everything else:
Net Profit ÷ Revenue × 100
Trend analysis across multiple periods matters more than a single figure. A declining net margin despite stable gross margin points directly to rising overhead costs. UK hospitality businesses, for example, typically operate on 3–5% net margins, while the best performers reach 15–20%.
Track this ratio monthly or quarterly to catch cost creep early.
Return on Capital Employed (ROCE)
ROCE measures how efficiently you're deploying invested capital:
Profit Before Interest and Tax ÷ Capital Employed × 100
Capital employed equals total assets minus current liabilities. UK investors and banks scrutinise ROCE because it shows whether your business generates acceptable returns from the capital invested.
According to ONS profitability data, all UK private non-financial corporations averaged 10.0% in Q2 2025. ROCE should ideally exceed your cost of borrowing — if you're borrowing at 7% but ROCE sits at 5%, debt is destroying value, not creating it.
Operating Profit Margin and Asset Turnover
ROCE doesn't tell you why performance is changing — but breaking it into components does. Operating profit margin (PBIT ÷ Revenue × 100) combined with asset turnover (Revenue ÷ Capital Employed) equals ROCE, giving you a precise diagnostic framework.
If ROCE is falling, this framework helps identify whether the problem is narrowing margins or declining asset utilisation. A manufacturer with strong margins but slow asset turnover needs to increase production efficiency. A retailer with high turnover but thin margins should focus on pricing or cost control.
Return on Equity (ROE)
ROE measures returns on shareholder capital:
Profit After Interest and Tax ÷ Total Equity × 100
For UK limited companies, ROE reveals whether retained earnings are being put to productive use. If ROE consistently lags sector peers, the practical response is to review dividend policy, assess whether reinvested profits are generating growth, or restructure underperforming assets before investors reach their own conclusions.
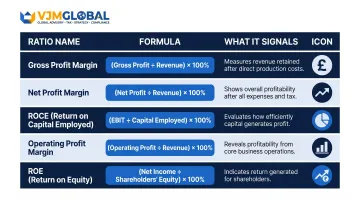
Quick Reference: Profitability Ratios at a Glance
| Ratio | Formula | What It Signals |
|---|---|---|
| Gross Profit Margin | Gross Profit ÷ Revenue × 100 | Core pricing and cost efficiency |
| Net Profit Margin | Net Profit ÷ Revenue × 100 | Overall cost control after overheads |
| ROCE | PBIT ÷ Capital Employed × 100 | Returns on total invested capital |
| Operating Profit Margin | PBIT ÷ Revenue × 100 | Operational efficiency before financing |
| ROE | Profit After Tax ÷ Total Equity × 100 | Returns generated for shareholders |
Liquidity and Efficiency Ratios: Managing Cash Flow and Working Capital
Current Ratio
The current ratio measures your ability to meet short-term debts:
Current Assets ÷ Current Liabilities
While a ratio of 2:1 was traditionally viewed as healthy, many UK businesses operate successfully closer to 1:1. Context matters. A retailer with fast inventory turnover can safely maintain a lower ratio than a manufacturer holding slow-moving stock.
Below 1:1, you may struggle to meet obligations as they fall due.
Quick Ratio (Acid Test)
The quick ratio excludes inventory from current assets:
Current Assets minus Stock ÷ Current Liabilities
This gives a more conservative view of liquidity. Prioritise the quick ratio over the current ratio when you hold slow-moving or hard-to-liquidate stock — particularly relevant for wholesalers, manufacturers, or businesses in seasonal sectors.
These two ratios give you a picture of liquidity at a point in time. To understand how quickly that liquidity cycles through your business, you need to look at collection and payment periods.
Debtor Days (Receivables Collection Period)
Debtor days measures how quickly customers pay:
Debtors ÷ Revenue × 365
Shorter debtor days improve cash flow and reduce bad debt risk. Research from the Small Business Commissioner found that late payments cost the UK economy almost £11 billion per year, with over 1.5 million businesses affected annually.
If you operate on 30-60 day payment terms but debtor days consistently exceed 70, you have a collections problem. On average, UK small firms are paid 5.8 days late, with 43% experiencing seasonal cash flow impacts.
Key debtor days strategies:
- Monitor this ratio monthly alongside aged debtor reports
- Benchmark against your stated payment terms (not industry averages)
- Implement credit control processes when debtor days exceed 45-50
- Consider invoice finance if debtor days consistently exceed 60
Creditor Days
Creditor days shows how long you take to pay suppliers:
Creditors ÷ Purchases × 365
Extended creditor days can support cash flow, but consistently slow payment damages supplier relationships and credit terms. UK lenders often treat unusually high creditor days as a warning sign that you're using supplier credit to cover shortfalls.
Getting the balance right:
- Pay on time to protect supplier goodwill and credit terms
- Avoid paying early at the cost of working capital
- Review creditor days alongside debtor days to spot cash flow mismatches
- Flag sustained increases to your accountant — they may signal underlying pressure
Stock (Inventory) Turnover
Stock turnover measures operational efficiency:
Cost of Goods Sold ÷ Average Stock Value
A slowing stock turnover points to excess inventory, slow-moving product lines, or weakening demand. For UK product-based businesses, this directly affects cash flow. If stock turnover drops from 8 times per year to 5, capital is sitting in unsold stock rather than working for the business.

Solvency and Gearing Ratios: Assessing Long-Term Financial Stability
Gearing Ratio
The gearing ratio reveals your reliance on debt financing:
Total Borrowings ÷ Net Worth of Business × 100
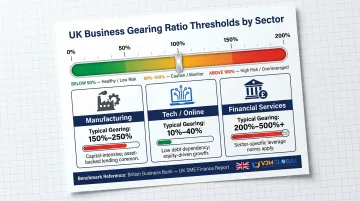
The British Business Bank states that a healthy debt-to-equity ratio generally sits between 1 and 1.5. Ratios above 2 are viewed as riskier, and above 3 typically raise concerns — unless your industry average is higher.
Capital-intensive sectors like manufacturing and financial services commonly operate with ratios above 2, while tech and online companies typically carry lower debt levels. As a rule of thumb, most UK lenders consider gearing above 50% a red flag.
Interest Cover
Interest cover shows how many times over you can cover interest payments:
Operating Profit ÷ Finance Costs
A ratio below 2x is considered risky; above 3x is generally seen as safe. HMRC guidance confirms that interest cover covenants are standard in third-party loan agreements, with 4:1 commonly used as a benchmark.
UK banks scrutinise this ratio closely when assessing loan applications. If interest cover drops below 2x, lenders may restrict further borrowing or increase rates.
Debt-to-Equity Ratio
Debt-to-equity differs from the broader gearing ratio:
Non-Current Liabilities ÷ Shareholders' Equity × 100
This ratio is particularly relevant for investors assessing financial risk in UK limited companies. Property, infrastructure, and manufacturing businesses typically operate comfortably at ratios of 1.5–2x, whereas service businesses are generally expected to stay below 1x.
ROCE vs. Cost of Borrowing
A key solvency health check: does ROCE exceed your interest rate on debt?
ROCE ÷ Cost of Debt (ROCE must exceed borrowing rate to add value)
If ROCE sits at 8% but you're borrowing at 9%, debt is destroying value. Review this comparison annually and before taking on any significant new borrowing.
How UK Businesses Can Use Accounting Ratios in Practice
Compare Against UK Industry Benchmarks
Ratios mean little in isolation. Use these sources to benchmark performance:
- ONS profitability datasets — sector-level ROCE and net rate of return
- Companies House — free access to filed accounts for comparable businesses
- Trade association reports specific to your sector
- Your own historical data — comparing current ratios against previous years reveals important trends
That last point matters even when external benchmarks aren't available — tracking your own ratios quarter-on-quarter is often the clearest signal of whether performance is improving or slipping.
Integrate Ratios into Regular Financial Reviews
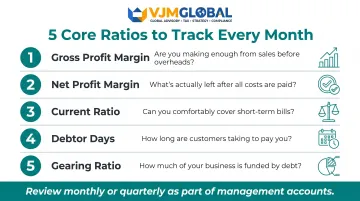
Incorporate key ratios into monthly or quarterly management accounts reviews. Track 3–5 core ratios consistently:
- Gross profit margin
- Net profit margin
- Current ratio
- Debtor days
- Gearing ratio
This discipline proves invaluable when preparing for bank loan applications, investor presentations, or year-end meetings with your accountant.
VJM Global has worked with 250+ UK businesses on cross-border accounting and financial reporting — particularly for those managing operations in India. If your business spans multiple jurisdictions, ratio analysis becomes more complex, and having advisors familiar with both UK and international standards makes a practical difference.
Key Limitations of Ratio Analysis Every UK Business Should Understand
Ratios are based on historical financial data and may not reflect your current position or future trajectory. Market shifts, new contracts, or recent investments can make past ratios misleading for forward-looking decisions. Use ratios as diagnostic tools, not predictions.
Ratios depend entirely on the accuracy of underlying financial data. Cross-industry comparisons can mislead: what constitutes a "healthy" gearing ratio or current ratio varies significantly across UK sectors. A retailer and a manufacturer cannot be meaningfully compared using the same benchmarks.
According to ACCA guidance, additional limitations include:
- Different accounting policies between companies (property revaluation, depreciation methods)
- Different year-ends making seasonal comparisons unreliable
- No universal ratio definitions (ROCE can be calculated multiple ways)
- Window dressing and creative accounting that artificially improve ratios
When reviewing ratios, pair them with qualitative context — management commentary, industry reports, and notes to the accounts often explain what the numbers alone cannot.
Frequently Asked Questions
What are the key accounting ratios?
The four main categories are profitability (gross profit margin, net profit margin, ROCE), liquidity (current ratio, quick ratio), efficiency (debtor days, creditor days, stock turnover), and solvency/gearing (gearing ratio, interest cover, debt-to-equity). Together, they give a well-rounded picture of where a business stands financially.
What is a good current ratio for a UK business?
While 2:1 was traditionally the benchmark, many UK businesses operate safely closer to 1:1. Acceptable ranges vary by industry — a retailer can sustain a lower ratio than a manufacturer with slow-moving inventory. Anything below 1:1 signals potential liquidity problems.
What is the difference between the current ratio and the quick ratio?
Both measure short-term liquidity, but the quick ratio excludes inventory from current assets — making it a stricter test. Use it when stock takes a long time to sell, as it gives a more accurate read of immediate cash availability.
How often should UK businesses review their accounting ratios?
Review key ratios monthly or quarterly as part of management accounts, with a more thorough annual analysis at year-end. Regular monitoring helps spot trends early rather than discovering problems only when filing annual accounts.
How do UK banks and lenders use accounting ratios?
UK lenders typically assess gearing, interest cover, current ratio, and ROCE when evaluating loan applications. Maintaining healthy ratios over time strengthens your creditworthiness and improves your chances of securing finance at competitive rates.
Can small businesses and sole traders benefit from tracking accounting ratios?
Even the smallest UK businesses benefit from tracking 3-5 key ratios regularly. They provide early warning signals, improve cash flow management, and make conversations with accountants or bank managers far more productive and focused on solutions.