%2520(3).avif)

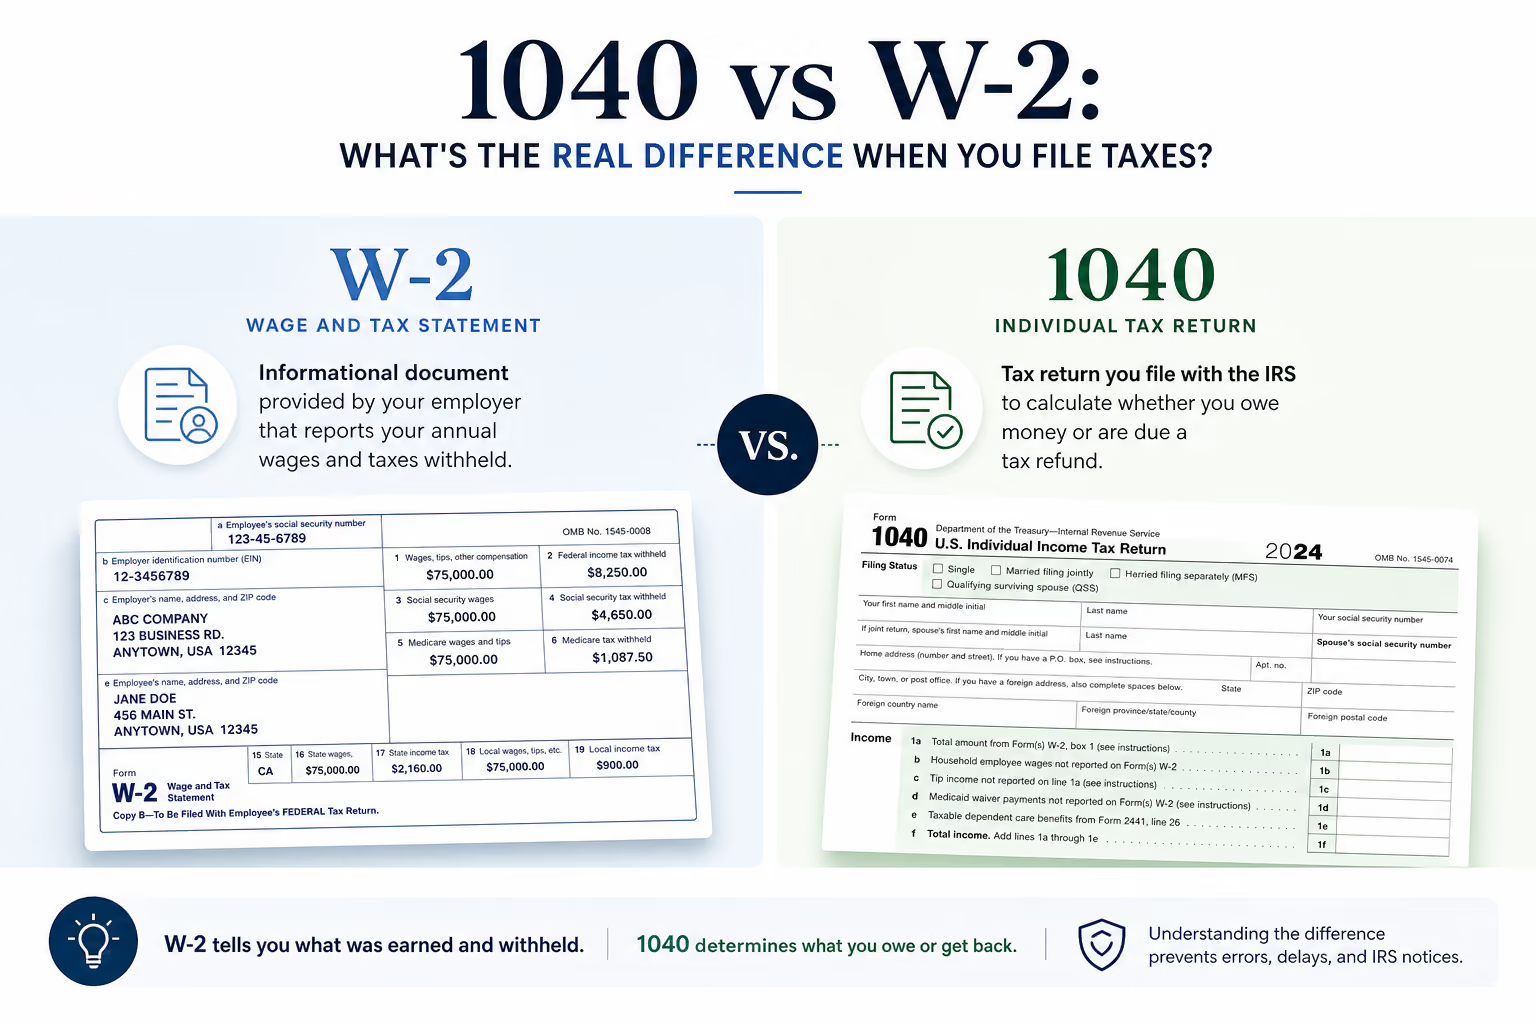
The 1040 tax table is the IRS-published schedule that converts a taxpayer's taxable income and filing status into a specific dollar amount of federal income tax owed. Form 1040 is used to report individual income taxes in the United States, and for filers whose taxable income falls below $100,000, the IRS directs them to use this table rather than computing tax through the Tax Computation Worksheet.
This article focuses on tax year 2025 (returns filed in 2026) and references how rules carry into tax year 2026 filed in 2027 under current law as of August 18, 2026. The 1040 tax table is separate from instructions for the alternative minimum tax, capital gains tax, self-employment tax, and other special taxes; those calculations happen on different forms and worksheets.
What follows is a section-by-section walkthrough of eligibility, table structure, worked examples, and planning strategies, drawn from VJM Global – USA's tax advisory practice.
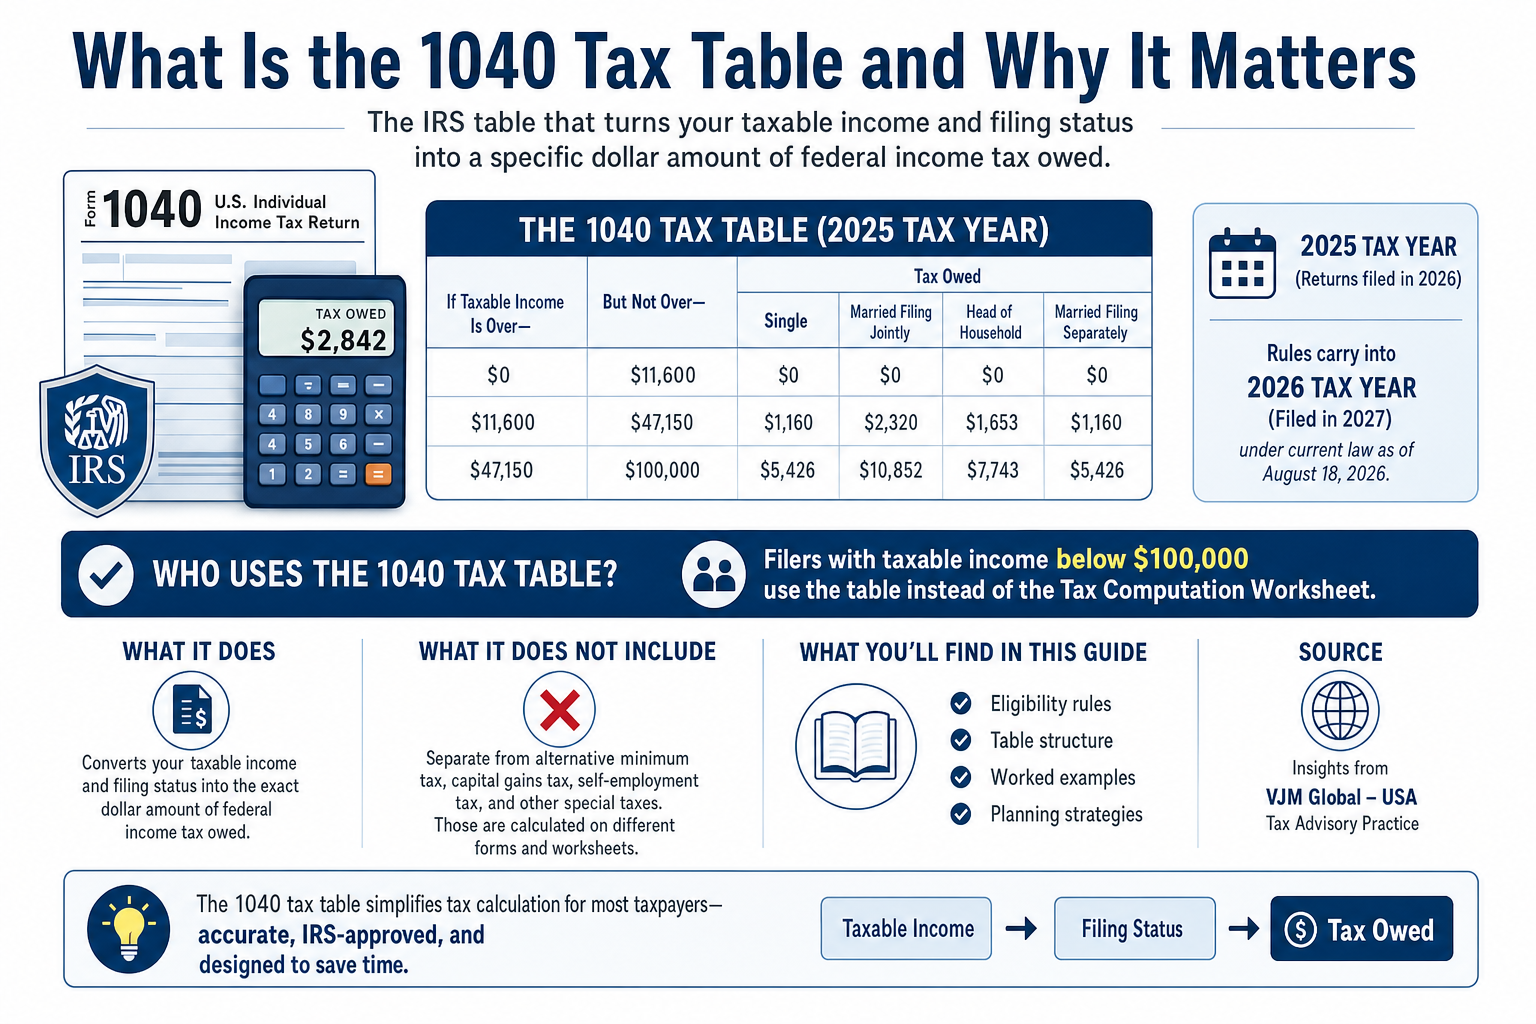
Taxpayers must use the IRS tax table if their taxable income is under $100,000 and they file Form 1040 or 1040-SR without special tax computations. That covers a large share of filers: single employees with W-2 wages, married filing jointly couples with salary income, retirees drawing Social Security plus modest IRA withdrawals, and heads of household with earned income and a dependent child or other qualifying dependents.
The table does not apply to everyone. Individuals with taxable income of $100,000 or more must switch to the Tax Computation Worksheet. Those with long-term capital gains or qualified dividends that require the Qualified Dividends and Capital Gain Tax Worksheet also bypass the standard table for the portion of income subject to preferential rates. Taxpayers subject to the alternative minimum tax compute AMT on Form 6251 separately. Estates and trusts use entirely different tables on Form 1041.
Tax software often hides the table from the user's view, but the underlying math still mirrors the IRS tax table or tax computation worksheet. Whether a filer sees it or not, the table logic drives the number that appears on their return.
The figure you bring to the 1040 tax table is taxable income, the amount shown on Form 1040, line 15 (for the 2025 format). Taxable income equals gross income minus deductions. Getting there involves a specific sequence:
The result is taxable income, which is used to determine federal tax liability.
Here is a concrete example. A single filer earns $75,000 in wages. She pays $2,000 in student loan interest (an above-the-line deduction) and takes the $15,000 standard deduction for single filers in 2025.
She enters $58,000 in the single column of the 1040 tax table. One detail worth noting: taxable income is always rounded down to the nearest whole dollar before referencing the table.
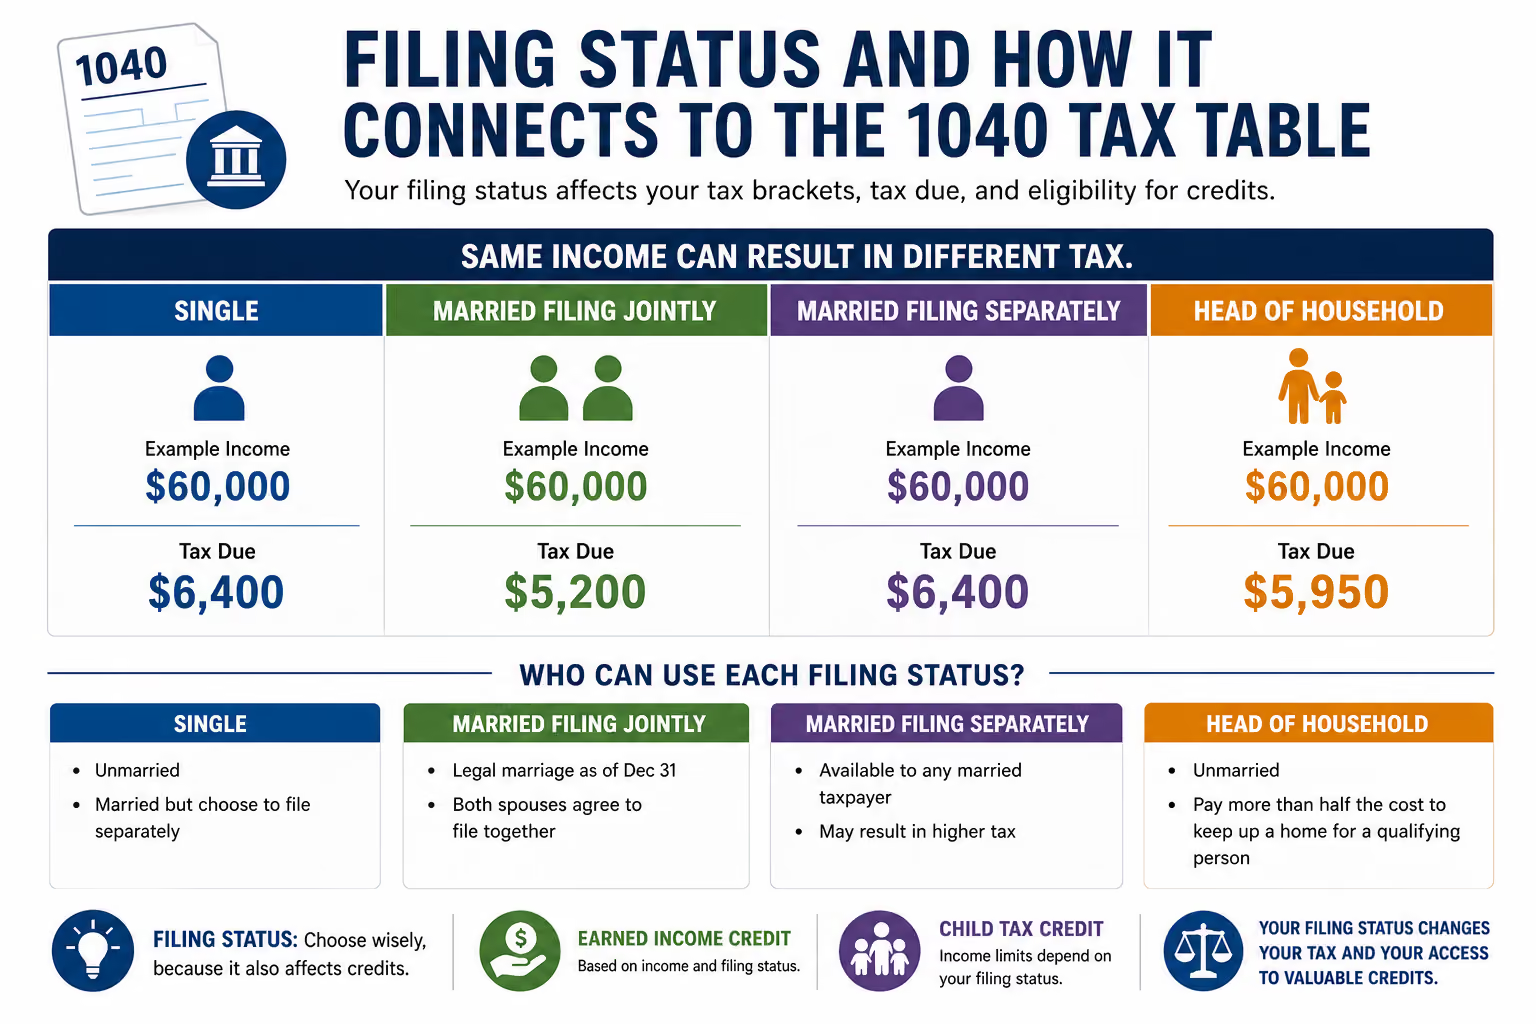
The 1040 tax table has separate columns for each filing status: single, married filing jointly, married filing separately, and head of household. A qualified surviving spouse generally uses the same column as married filing jointly. Filing status determines the width of each tax bracket and the starting point for phaseouts on credits and deductions.
Eligibility for each status depends on specific criteria. Married filing jointly requires a legal marriage as of December 31 of the tax year. Married filing separately is available to any married taxpayer who chooses (or needs) to file separate returns; a spouse died during the tax year may still allow a joint tax return for that year. Head of household requires the filer to be unmarried (or considered unmarried under IRS rules, including legally separated individuals) and to have paid more than half the cost of keeping up a home for a qualifying child or taxpayer's dependent parent for more than one half of the year. The filer must be the primary provider of the household for more than half the year. Marital status on the last day of the year controls filing status choices.
The same taxable income generates different tax amounts depending on which column you read. A single filer with $60,000 of taxable income owes more than a married filing jointly couple with $60,000 of taxable income, because the joint brackets are wider. Filing status choose wisely, because it also interacts with credits. The earned income credit, for example, is unavailable to married taxpayers who file separately, and the Child Tax Credit phases out at different income thresholds depending on other filing status categories.
There are seven federal income tax rates in 2025: 10%, 12%, 22%, 24%, 32%, 35%, and 37%. Tax rates apply only to the income within a given bracket in a progressive tax system, meaning each dollar is taxed at its own marginal rate, not at a single flat rate. The 1040 tax table simplifies tax calculations by pre-computing tax for income brackets across all levels up to $99,999.
The table output is the total tax for that slice of taxable income, not just the tax at the top bracket. Two filers both in the 22% tax bracket can pay different effective tax rates because earlier portions of their income are taxed at 10% and 12%. A single filer with $50,000 of taxable income and another with $80,000 are both in the 22% bracket, but the second filer has more income taxed at 22%, pushing the effective rate higher.
Taxpayers with taxable income at or above $100,000 use the Tax Computation Worksheet or software that mirrors the marginal tax bracket formula. The math is the same; the worksheet just handles larger numbers that the printed table does not cover.
Start with the taxable income on Form 1040, line 15. Then find the correct filing status column in the table. Locate the income row that contains your taxable income. Income brackets in the tax table typically span increments of $50, so the rows appear as ranges (for example, $48,500 to $48,550). Read across to your filing status column, and the number you land on is your tax.
Consider a married filing jointly couple with $48,500 of total taxable income. They open the 1040 tax table to the page covering the $48,000–$49,000 range. They find the row labeled "$48,500–$48,550." In the "Married filing jointly" column, they read the pre-computed tax. That figure already accounts for the fact that their first $23,850 (the MFJ 10% bracket threshold for 2025) was taxed at 10%, the next portion at 12%, and so on.
The tax amounts in the table are rounded to the nearest dollar, which can cause small differences (a dollar or two) compared with a manual bracket-by-bracket calculation. Those rounding differences are normal and accepted by the IRS.
Common errors to watch for: using the single column when you qualify as head of household, which overstates tax; referencing AGI instead of taxable income, which inflates the lookup figure; or pulling the wrong year's table from the instructions.
The IRS instructions for Form 1040 include both the tax table and a Tax Computation Worksheet. The "Which method to use" guidance is straightforward. The IRS requires a Tax Computation Worksheet for taxable income of $100,000 or more. Below that threshold, taxpayers use the 1040 tax table.
Long-term capital gains and qualified dividends may trigger a separate worksheet (the Qualified Dividends and Capital Gain Tax Worksheet) that overrides the regular tax table for the portion of income subject to the lower 0%, 15%, or 20% rates. Self employment taxes, calculated on Schedule SE, are not included in the 1040 tax table calculation. They are added afterward on the return via Schedule 2 (Additional Taxes).
VJM Global – USA uses professional software that automatically selects the correct method, supported by expert U.S. tax return preparation outsourcing services that ensure consistency with IRS rules and workflows. We still cross-check results against IRS tables in complex cases, especially when a client's income hovers near $100,000 or includes a mix of ordinary income and preferentially taxed gains.
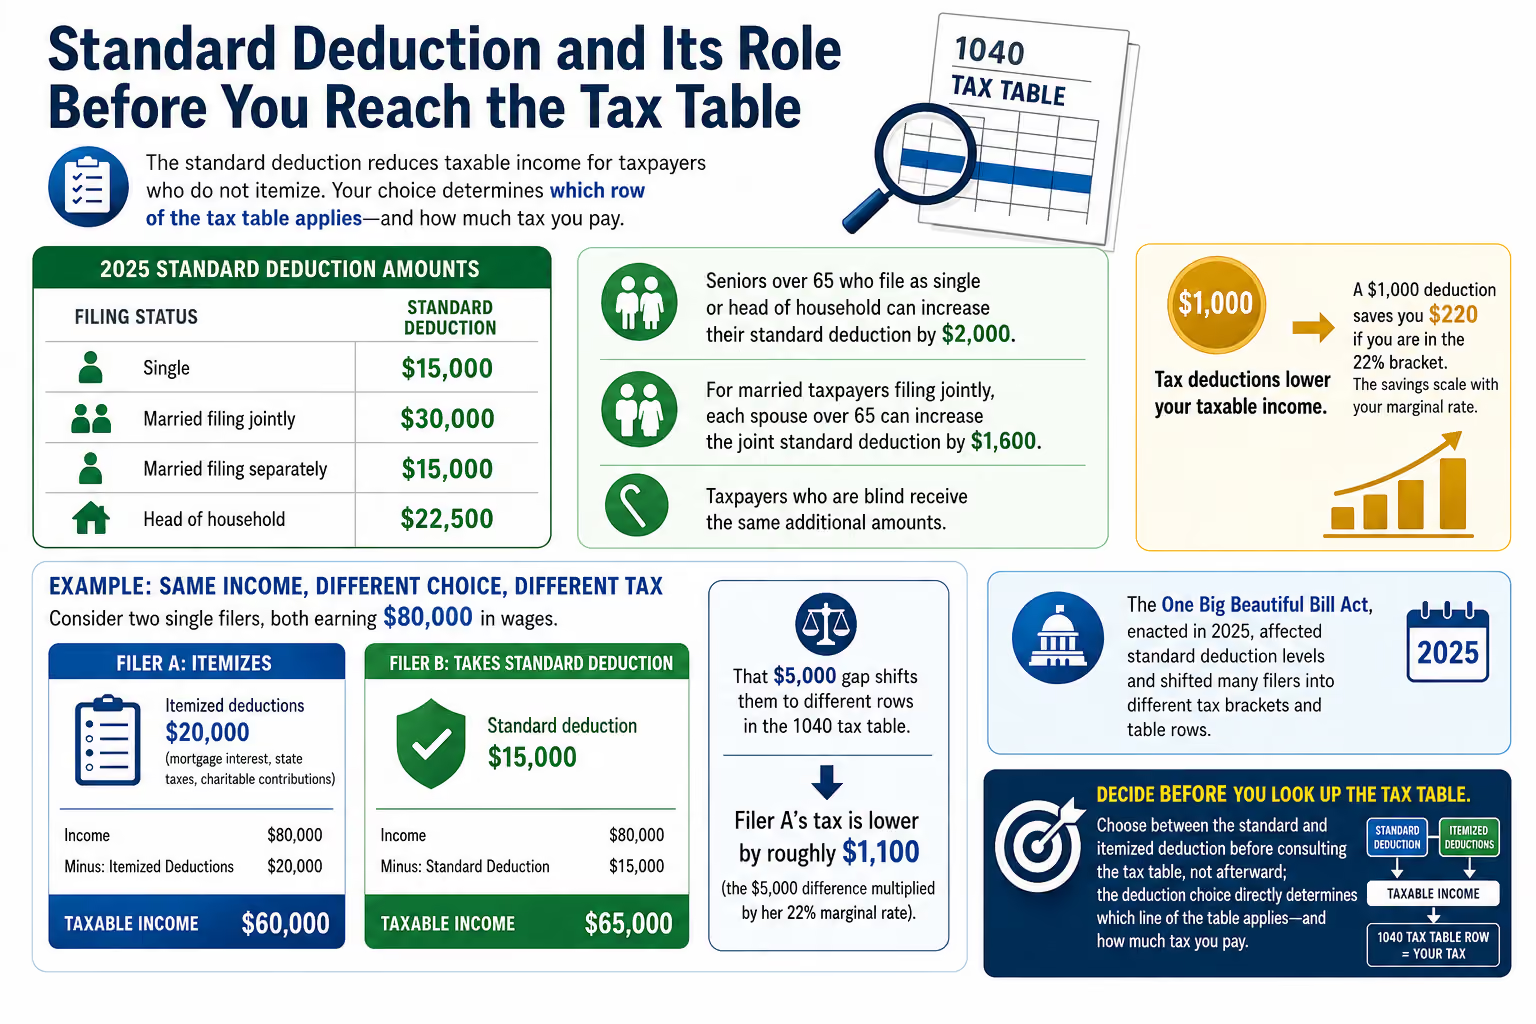
The standard deduction reduces taxable income for taxpayers who do not itemize. Standard deductions vary by filing status and age. For tax year 2025:
Tax deductions lower your taxable income amount. A $1,000 deduction saves you $220 if you are in the 22% bracket. The savings scale with your marginal rate.
Consider two single filers, both earning $80,000 in wages. Filer A itemizes $20,000 in deductions (mortgage interest, state taxes, charitable contributions). Filer B takes the $15,000 standard deduction. Filer A's taxable income is $60,000; Filer B's is $65,000. That $5,000 gap shifts them to different rows in the 1040 tax table, and Filer A's tax is lower by roughly $1,100 (the $5,000 difference multiplied by her 22% marginal rate).
The One Big Beautiful Bill Act, enacted in 2025, affected standard deduction levels and shifted many filers into different tax brackets and table rows. Taxpayers should decide between the standard and itemized deduction before consulting the tax table, not afterward; the deduction choice directly determines which line of the table applies.
The 1040 tax table shows the initial tax on taxable income, before applying most nonrefundable and refundable credits. Key credits that follow the table calculation include:
Tax credits reduce your tax bill dollar-for-dollar. Nonrefundable credits can reduce the tax from the table down to zero but cannot produce a refund on their own. Refundable credits, like the refundable portion of the Child Tax Credit (up to $1,700 in 2025) and most of the earned income tax credit, can generate a tax refund even when the table-based tax is already zero.
Here is how the math works for a head of household filer with two children and $4,000 of tax from the 1040 tax table. The Child Tax Credit provides $4,400 (2 children x $2,200), reducing the table tax to $0. The remaining $400 of nonrefundable credit is lost unless the refundable portion applies. Then the earned income credit adds a refundable amount on top, resulting in a net refund.
Tax planning at VJM Global – USA focuses not just on the tax table number but on maximizing credits tied to earned income and qualifying dependents.
For 2025, the maximum credit per qualifying child under the Child Tax Credit is $2,200, with a refundable portion of $1,700. Income thresholds and phaseouts for the Child Tax Credit use modified adjusted gross income, which may differ from taxable income. The phaseout begins at higher MAGI levels, and the credit reduces gradually as income increases above the applicable threshold.
The earned income tax credit operates on different inputs. The maximum earned income tax credit is $8,046 for taxpayers with three or more qualifying children. The full schedule of maximum credit amounts for 2025:
Consider a head of household filer with two children, $32,000 of earned income, and $24,000 of taxable income after the standard deduction. The 1040 tax table shows approximately $2,640 of tax. The Child Tax Credit provides $4,400, reducing the table tax to $0 (with the refundable portion kicking in). The earned income credit then adds up to $7,152 as a refundable income credit. The net result is a refund of several thousand dollars, despite the filer having positive taxable income.
In planning meetings, we often model how small changes in earned income levels can affect both the tax table amount and eligibility for these credits. A few hundred dollars of additional income can push a client past a phaseout threshold.
Certain above-the-line deductions reduce adjusted gross income before the standard deduction is applied, which in turn lowers taxable income before the 1040 tax table is consulted. The student loan interest deduction allows eligible taxpayers to deduct up to $2,500 of interest paid, subject to income phaseouts. HSA contributions and traditional IRA contributions also reduce AGI.
These adjustments are not visible within the tax table itself, but they change the output. A single filer earning $65,000 who claims $2,000 in student loan interest drops from $65,000 to $63,000 of AGI. After the $15,000 standard deduction, taxable income falls from $50,000 to $48,000. That shift moves the filer from the lower end of the 22% bracket into the 12% bracket for those last $2,000 of income. The tax savings exceed $2,000 multiplied by the 12% rate; the filer avoids the 22% rate entirely on that slice.
Thoughtful use of adjustments is a standard technique for VJM Global – USA clients with predictable earned income. Timing IRA contributions, maximizing HSA deposits, and documenting student loan interest can all shift taxable income into a more favorable row of the tax table.
Long-term capital gains and qualified dividends are taxed using a separate set of rates: 0%, 15%, or 20%, depending on income levels. For single filers in 2025, the 0% rate applies to taxable income (including the gains) up to $48,350. For married filing jointly, that threshold is $96,700. For head of household, it is $64,750.
When a taxpayer has capital gains or qualified dividends, the IRS typically requires the Qualified Dividends and Capital Gain Tax Worksheet instead of the standard 1040 tax table. That worksheet splits taxable income into ordinary income (taxed at regular rates) and preferentially taxed gains (taxed at the lower capital gain rates).
Here is why this matters. A single filer has $40,000 of wages and $10,000 of long-term capital gain. After the $15,000 standard deduction, taxable income is $35,000. If this filer mistakenly applied the ordinary 1040 tax table to the entire $35,000, she would overpay. Because $35,000 is below the $48,350 zero-rate threshold for singles, the $10,000 of long-term capital gain is taxed at 0%. The worksheet catches this; the tax table does not.
VJM Global – USA reviews Form 1099-B and 1099-DIV details for every client to make sure no income subject to preferential rates is being taxed at ordinary income rates.
The alternative minimum tax is a parallel tax system with its own exemptions and rates, designed so high income taxpayers pay at least a minimum amount of federal tax. The AMT exemption amount for 2025 is $88,100 for single filers and head of household, $137,000 for married filing jointly, and $68,500 for married filing separately. Phaseout of the AMT exemption begins at $626,350 for singles and $1,252,700 for joint filers.
Taxpayers must calculate tax twice: once using the regular rules and 1040 tax table (or worksheet), and once using AMT rules on Form 6251. They owe whichever amount is higher. The AMT is not integrated into the 1040 tax table.
Most lower- and moderate-income taxpayers who use the standard 1040 tax table will not trigger AMT. Business owners, high-income W-2 earners, and those with large state and local tax deductions are the groups most likely to face AMT exposure. We monitor this for clients at VJM Global – USA, especially those whose income fluctuates year to year.
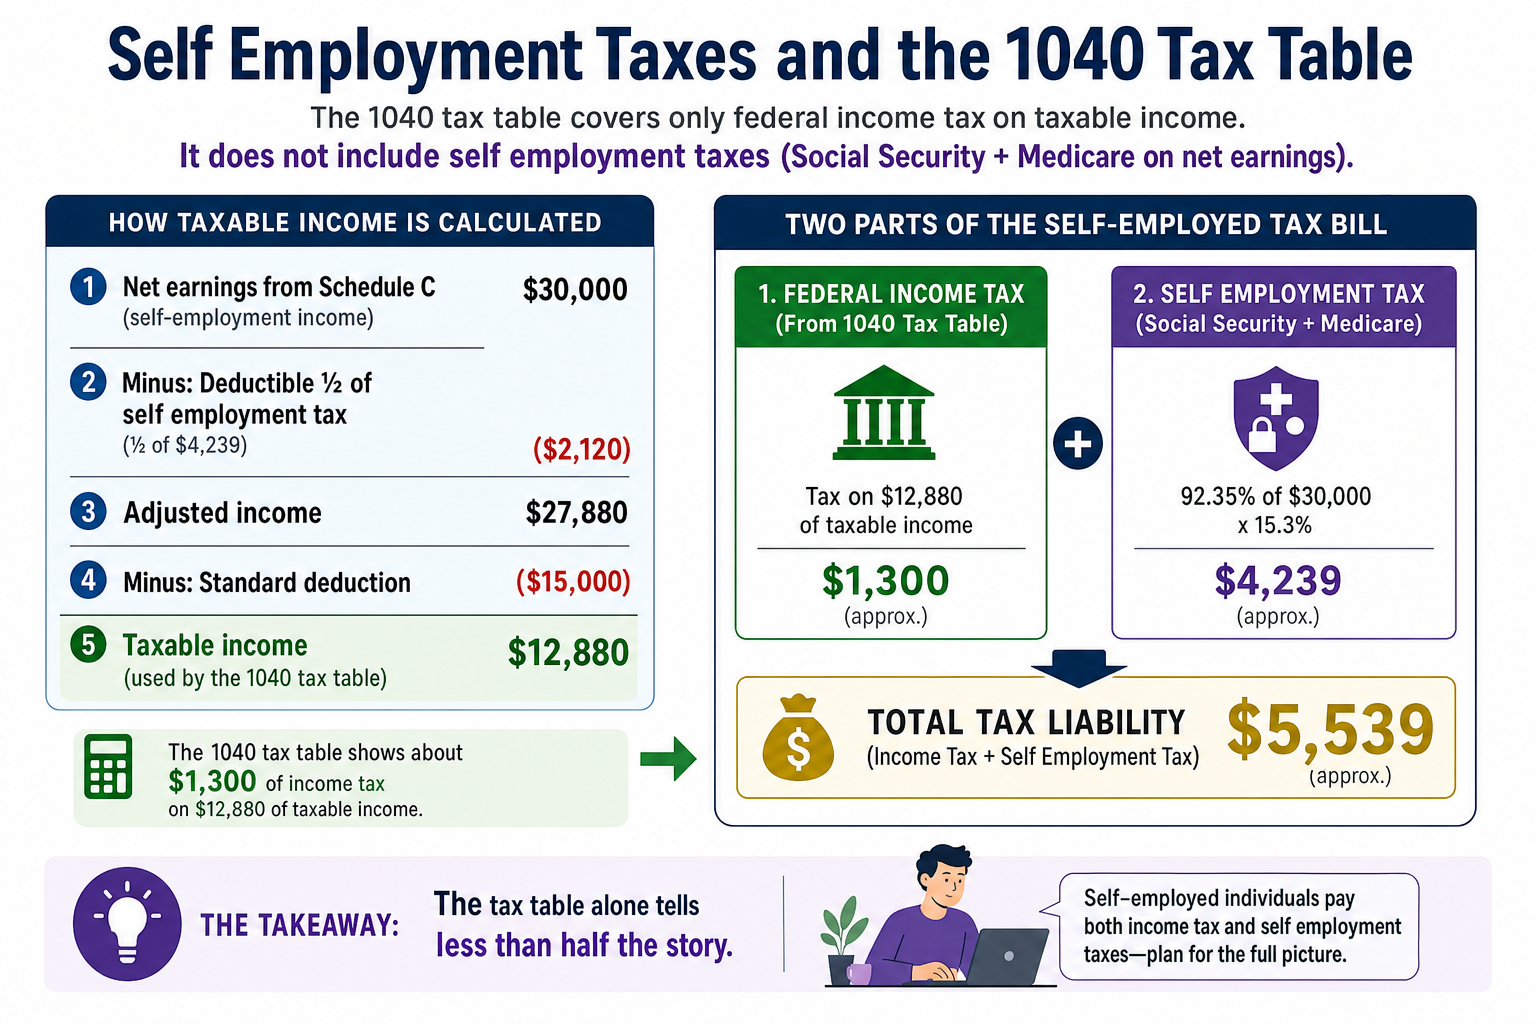
The 1040 tax table covers only federal income tax on taxable income. It does not include self employment taxes, which are the combined Social Security and Medicare taxes on net earnings from self-employment. Individuals who pay self employment taxes calculate them on Schedule SE, and the result is reported separately on Form 1040 via Schedule 2.
Half of the self employment taxes are deductible as an adjustment to income. This slightly reduces taxable income and the tax table amount.
Consider a freelancer with $30,000 of net Schedule C income and no other earnings. Self employment taxes run approximately $4,239 (92.35% of $30,000 x 15.3%). Half of that, about $2,120, is deductible above the line. After the $15,000 standard deduction, taxable income drops to roughly $12,880. The 1040 tax table shows about $1,300 of income tax. But the freelancer also owes the full $4,239 in self employment taxes, for a combined liability of roughly $5,539. The tax table alone tells less than half the story.
Many self-employed clients of VJM Global – USA benefit from entity planning (LLC, S-corp election) and expert tax preparation services for LLCs and LLPs in the USA to optimize both income taxes and self employment taxes, not just the figure coming from the table.
Earned income (wages, self-employment profits) and other types of income (taxable interest, capital gains, tax exempt interest) play different roles in the credits and phaseouts that surround the 1040 tax table calculation. The earned income credit and the Saver's Credit are based on specific income levels and AGI limits, even though the tax table is keyed only to taxable income.
Moving from $35,000 to $40,000 of earned income increases the tax table amount, but if that same jump pushes AGI past an earned income credit phaseout, the taxpayer may lose more in credit reduction than the extra income is worth after taxes. Generally speaking, these "cliff" effects are most acute for filers with two or three children, where the maximum credit amounts are large enough to create noticeable swings in net tax liability as income increases.
At VJM Global – USA, we focus on keeping clients within favorable income bands where marginal effective tax rates, including lost credits, remain reasonable. Part-year work, retirement, or business expansion can push taxpayers into new brackets and credit phaseouts in the upcoming tax year, and modeling those shifts in advance avoids surprises.
Individuals can estimate their year-end tax by projecting taxable income and consulting the 1040 tax table for the current tax year. The workflow is straightforward:
This quick method is especially useful in November and December when deciding on additional 401(k) contributions, IRA contributions, or timing of deductible expenses.
A single filer projects $70,000 of wages, $2,000 in adjustments, and the $15,000 standard deduction, landing at $53,000 of taxable income. The 1040 tax table shows approximately $6,760 of tax. If she makes an extra $3,000 retirement contribution, taxable income drops to $50,000 and the table shows about $6,100. The $3,000 contribution saves $660, which reflects the 22% marginal rate on that slice of income. Financial calculators can give a faster answer, but the table itself serves as a good cross-check.
VJM Global – USA refines these estimates with more detailed modeling that also considers capital gains, AMT, and multi-state taxes, drawing on global tax, accounting, and business consulting services and using displayed output values from professional tax projection tools alongside the following form fields from draft returns.
The most frequent errors we see in practice:
Cross-checking a manual table result with IRS instructions or professional software is advisable whenever multiple forms of income are involved.
The seven federal tax rates for 2025 are embedded in the 1040 tax table. In 2025, the top tax rate is 37%. Here are the taxable income thresholds for single and married filing jointly:
The 37% rate applies to income above $626,350 for singles. Married couples filing jointly face the 37% rate above $751,600. For married filing separately, the top rate kicks in above $375,800. The top marginal tax rate in 2025 is 37% for high earners, but the effective rate for most taxpayers is well below their top bracket because the progressive structure taxes earlier dollars at lower rates.
The IRS publishes these brackets each year via revenue procedure, specifically Revenue Procedure 2024-40 for tax year 2025. The 1040 tax table is then updated to match these inflation adjustments in the Instructions for Form 1040.
A single filer with $80,000 of taxable income is in the 22% tax bracket, but her effective federal tax rate is approximately 14.3%. The table shows about $11,430 of tax. A flat 22% on $80,000 would be $17,600. The gap exists because the first $11,925 is taxed at 10% and the next $36,550 at 12%.
The IRS updates the 1040 tax table every tax year. Changes reflect inflation adjustments to tax brackets, standard deduction amounts, and any legislative modifications such as those from the Tax Cuts and Jobs Act or the Big Beautiful Bill Act. The official 1040 tax table is published in the Instructions for Form 1040 (usually as a multi-page appendix) and is available as a downloadable PDF at IRS.gov.
Using the wrong year's table can produce material errors. In periods of high inflation, bracket thresholds shift enough that a filer could land in a different row and pay the wrong amount. Tax software providers automatically incorporate the latest table; paper filers must confirm they have the correct year's instructions.
For perspective on upcoming changes: the standard deduction for 2026 is $16,100 for singles and $32,200 for married couples. The 2026 federal income tax system employs seven marginal tax rates of 10% to 37%, continuing the same structure. Purchasing power adjustments keep these thresholds aligned with inflation, so calculated values in the table shift upward each year.
VJM Global – USA monitors IRS revenue procedures and instructions annually to make sure client advice reflects current thresholds and federal tax rates.
A dependent child who files their own return still uses the 1040 tax table, but their standard deduction is limited. For 2025, a dependent's standard deduction is the greater of $1,350 or earned income plus $450, capped at the normal standard deduction for their filing status. A college student with $7,000 of earned income from a part-time job would have a standard deduction of $7,450 ($7,000 + $450). Taxable income would be zero if they had no other income, and the tax table would show no tax owed.
If that same student also earned $2,000 in taxable interest from a savings account, total income would be $9,000, and taxable income after the $7,450 standard deduction would be $1,550. The 1040 tax table would show approximately $155 of federal tax.
Part-year residents or individuals with multiple state returns use the same federal 1040 tax table but face complex state-level calculations on top, and businesses with historical filing issues may also require professional tax resolution services for USA businesses to reconcile prior-year discrepancies. Scholarship income that exceeds qualified education expenses is taxable and enters the same gross income calculation.
Parents claiming a child as a dependent must coordinate. The dependent's return and the parents' return can affect each other's standard deduction and credits. Parents cannot claim the Child Tax Credit if the child files a joint tax return with a spouse, for instance.
Individuals running side businesses through freelance work, gig platforms, or consulting ultimately pay federal income tax based on their combined taxable income, with the 1040 tax table applying to that total. A W-2 employee who picks up $20,000 of Schedule C profit sees that income added to wages before the table is consulted.
The Qualified Business Income (QBI) deduction under Section 199A can reduce taxable income by up to 20% of qualified business income for pass-through businesses under certain income thresholds. That deduction is subtracted before line 15, lowering the figure that enters the tax table.
Take a single filer with $60,000 in W-2 wages and $20,000 in net Schedule C profit. After a $4,000 QBI deduction (20% of $20,000) and the $15,000 standard deduction, taxable income is $61,000. Without the QBI deduction, taxable income would be $65,000. The tax table difference is roughly $880, reflecting the 22% marginal rate applied to that $4,000 gap.
Business owners also need to account for self employment taxes on the $20,000 of Schedule C profit, estimated quarterly payments, and any retirement plan contributions (SEP IRA, Solo 401(k)) that further reduce taxable income, often supported by secure remote accounting and bookkeeping services. The tax table is one piece of a larger calculation.
At VJM Global – USA, we work with individuals, executives, and business owners to model different income and deduction scenarios before year-end using the same logic as the 1040 tax table. Our professionals review wage income, self-employment income, capital gains, retirement contributions, and credits to estimate both current-year tax and the next year's withholding or estimated tax needs.
Clients expanding internationally face additional layers. A US company investing in India, for example, needs coordinated planning so cross-border income flows correctly into their Form 1040, AMT computations, and any applicable foreign tax credits, and real estate investors may additionally rely on outsourced real estate accounting services to keep property-level records aligned with federal tax reporting. The tax table still applies to the US-side ordinary income; the question is what number reaches it after foreign income and credits are accounted for.
Our technology stack (QuickBooks, Xero, NetSuite, and professional tax software) aligns bookkeeping, year-end financials, and tax table-based computations for more accurate projections, supported by complete business accounting services for U.S. companies from India. Clients can reach our US office at 447 Broadway, 2nd Floor, #2964, New York, NY 10013 or email [email protected].
Modern tax software embeds the 1040 tax table logic, so users rarely look at the table directly. The software's result should match the IRS table for straightforward returns with taxable income under $100,000. For more complex returns involving capital gains worksheets, AMT, or non-taxable combat pay exclusions, the software runs additional calculations beyond the basic table. Keeping a copy of the table is still useful for spot-checking the software's output.
Using the wrong line or filing status column will misstate tax. If you underpay, the IRS may assess penalties and interest. If you overpay, the IRS typically corrects obvious arithmetic errors during processing, but corrections can delay a tax refund. For filers whose other filing status would result in a lower tax (for example, head of household instead of single), the IRS does not automatically reclassify the return; the taxpayer must amend.
The 1040 tax table covers only federal income tax. Each state with an income tax has its own rules, brackets, and sometimes its own tables or worksheets. Some states use federal AGI as a starting point; others start from a different base. Filing federal and state returns are separate processes, even though the income figures overlap.
All wages from multiple jobs are combined on the federal return to determine total taxable income. The tax table is applied to the total, not to each job separately. This often pushes the taxpayer into a higher bracket than either job's income alone would suggest. W-4 withholding at each job may be set too low unless the taxpayer adjusts using the IRS multiple-jobs worksheet or the Tax Withholding Estimator. Underwithholding from multiple jobs is one of the most common causes of an unexpected balance due at filing.
Retaining a copy of the instructions and tax table used for each year's return is a good practice. Keep it for at least as long as you keep the return itself, which the IRS recommends as three years from the filing date (or longer if certain conditions apply, such as underreported income by more than 25%). Having the correct year's table on file makes it easier to respond to IRS correspondence or review prior filings.
{"@context":"https://schema.org","@type":"FAQPage","mainEntity":[{"@type":"Question","name":"Do I still need the 1040 tax table if I use tax software?","acceptedAnswer":{"@type":"Answer","text":"Modern tax software embeds the 1040 tax table logic, so users rarely look at the table directly. The software's result should match the IRS table for straightforward returns with taxable income under $100,000. For more complex returns involving capital gains worksheets, AMT, or non-taxable combat pay exclusions, the software runs additional calculations beyond the basic table. Keeping a copy of the table is still useful for spot-checking the software's output."}},{"@type":"Question","name":"What happens if I use the wrong line or column in the tax table?","acceptedAnswer":{"@type":"Answer","text":"Using the wrong line or filing status column will misstate tax. If you underpay, the IRS may assess penalties and interest. If you overpay, the IRS typically corrects obvious arithmetic errors during processing, but corrections can delay a tax refund. For filers whose other filing status would result in a lower tax (for example, head of household instead of single), the IRS does not automatically reclassify the return; the taxpayer must amend."}},{"@type":"Question","name":"Does the 1040 tax table include state income tax?","acceptedAnswer":{"@type":"Answer","text":"The 1040 tax table covers only federal income tax. Each state with an income tax has its own rules, brackets, and sometimes its own tables or worksheets. Some states use federal AGI as a starting point; others start from a different base. Filing federal and state returns are separate processes, even though the income figures overlap."}},{"@type":"Question","name":"How does the 1040 tax table work if I have more than one job?","acceptedAnswer":{"@type":"Answer","text":"All wages from multiple jobs are combined on the federal return to determine total taxable income. The tax table is applied to the total, not to each job separately. This often pushes the taxpayer into a higher bracket than either job's income alone would suggest. W-4 withholding at each job may be set too low unless the taxpayer adjusts using the IRS multiple-jobs worksheet or the Tax Withholding Estimator. Underwithholding from multiple jobs is one of the most common causes of an unexpected balance due at filing."}},{"@type":"Question","name":"Should I keep a copy of the 1040 tax table with my records?","acceptedAnswer":{"@type":"Answer","text":"Retaining a copy of the instructions and tax table used for each year's return is a good practice. Keep it for at least as long as you keep the return itself, which the IRS recommends as three years from the filing date (or longer if certain conditions apply, such as underreported income by more than 25%). Having the correct year's table on file makes it easier to respond to IRS correspondence or review prior filings."}}]}