%20(12).avif)
La fabricación depende totalmente de datos de costes precisos. En julio de 2025, los fabricantes estadounidenses mantenían cerca de 952.000 millones de dólares en inventarios totales, un nivel que puede alterar los márgenes si los costes se registran o valoran incorrectamente. En el mismo trimestre, los costes laborales unitarios en la fabricación aumentaron un 2,0%, recordando a los equipos financieros que los pequeños cambios en la planta de producción se reflejan rápidamente en la cuenta de resultados.
Contar con métodos claros para el cálculo de costes, la valoración de inventarios y la conciliación del coste de los productos fabricados (COGM) y el coste de los productos vendidos (COGS) convierte esta situación dinámica en decisiones de confianza. Si su presencia abarca EE. UU. y la India, las políticas coherentes y las definiciones compartidas son aún más importantes, ya que entran en juego diferentes normas y divisas.
En este blog, exploraremos en detalle la contabilidad para fabricantes, en qué consiste, los componentes clave de los costes y cómo calcular métricas críticas como el coste de los productos fabricados (COGM) y el coste de los productos vendidos (COGS).
La contabilidad de fabricación es una rama especializada de la contabilidad de costes y de gestión que se ocupa de todos los costes incurridos en la producción de bienes físicos. Realiza un seguimiento de los materiales directos, la mano de obra directa y los gastos generales de fabricación, asigna estos costes a las unidades producidas y ayuda a valorar el inventario final y el COGS.
A diferencia de la contabilidad financiera general, la contabilidad de fabricación se centra estrechamente en el proceso de producción y respalda la toma de decisiones interna, aunque muchos de sus resultados también afectan a los estados financieros externos y a las divulgaciones reglamentarias.
Una vez que comprenda lo que abarca la contabilidad de fabricación, el siguiente paso es analizar los diferentes tipos de contabilidad que trabajan juntos para mantener las finanzas de una fábrica precisas y transparentes.
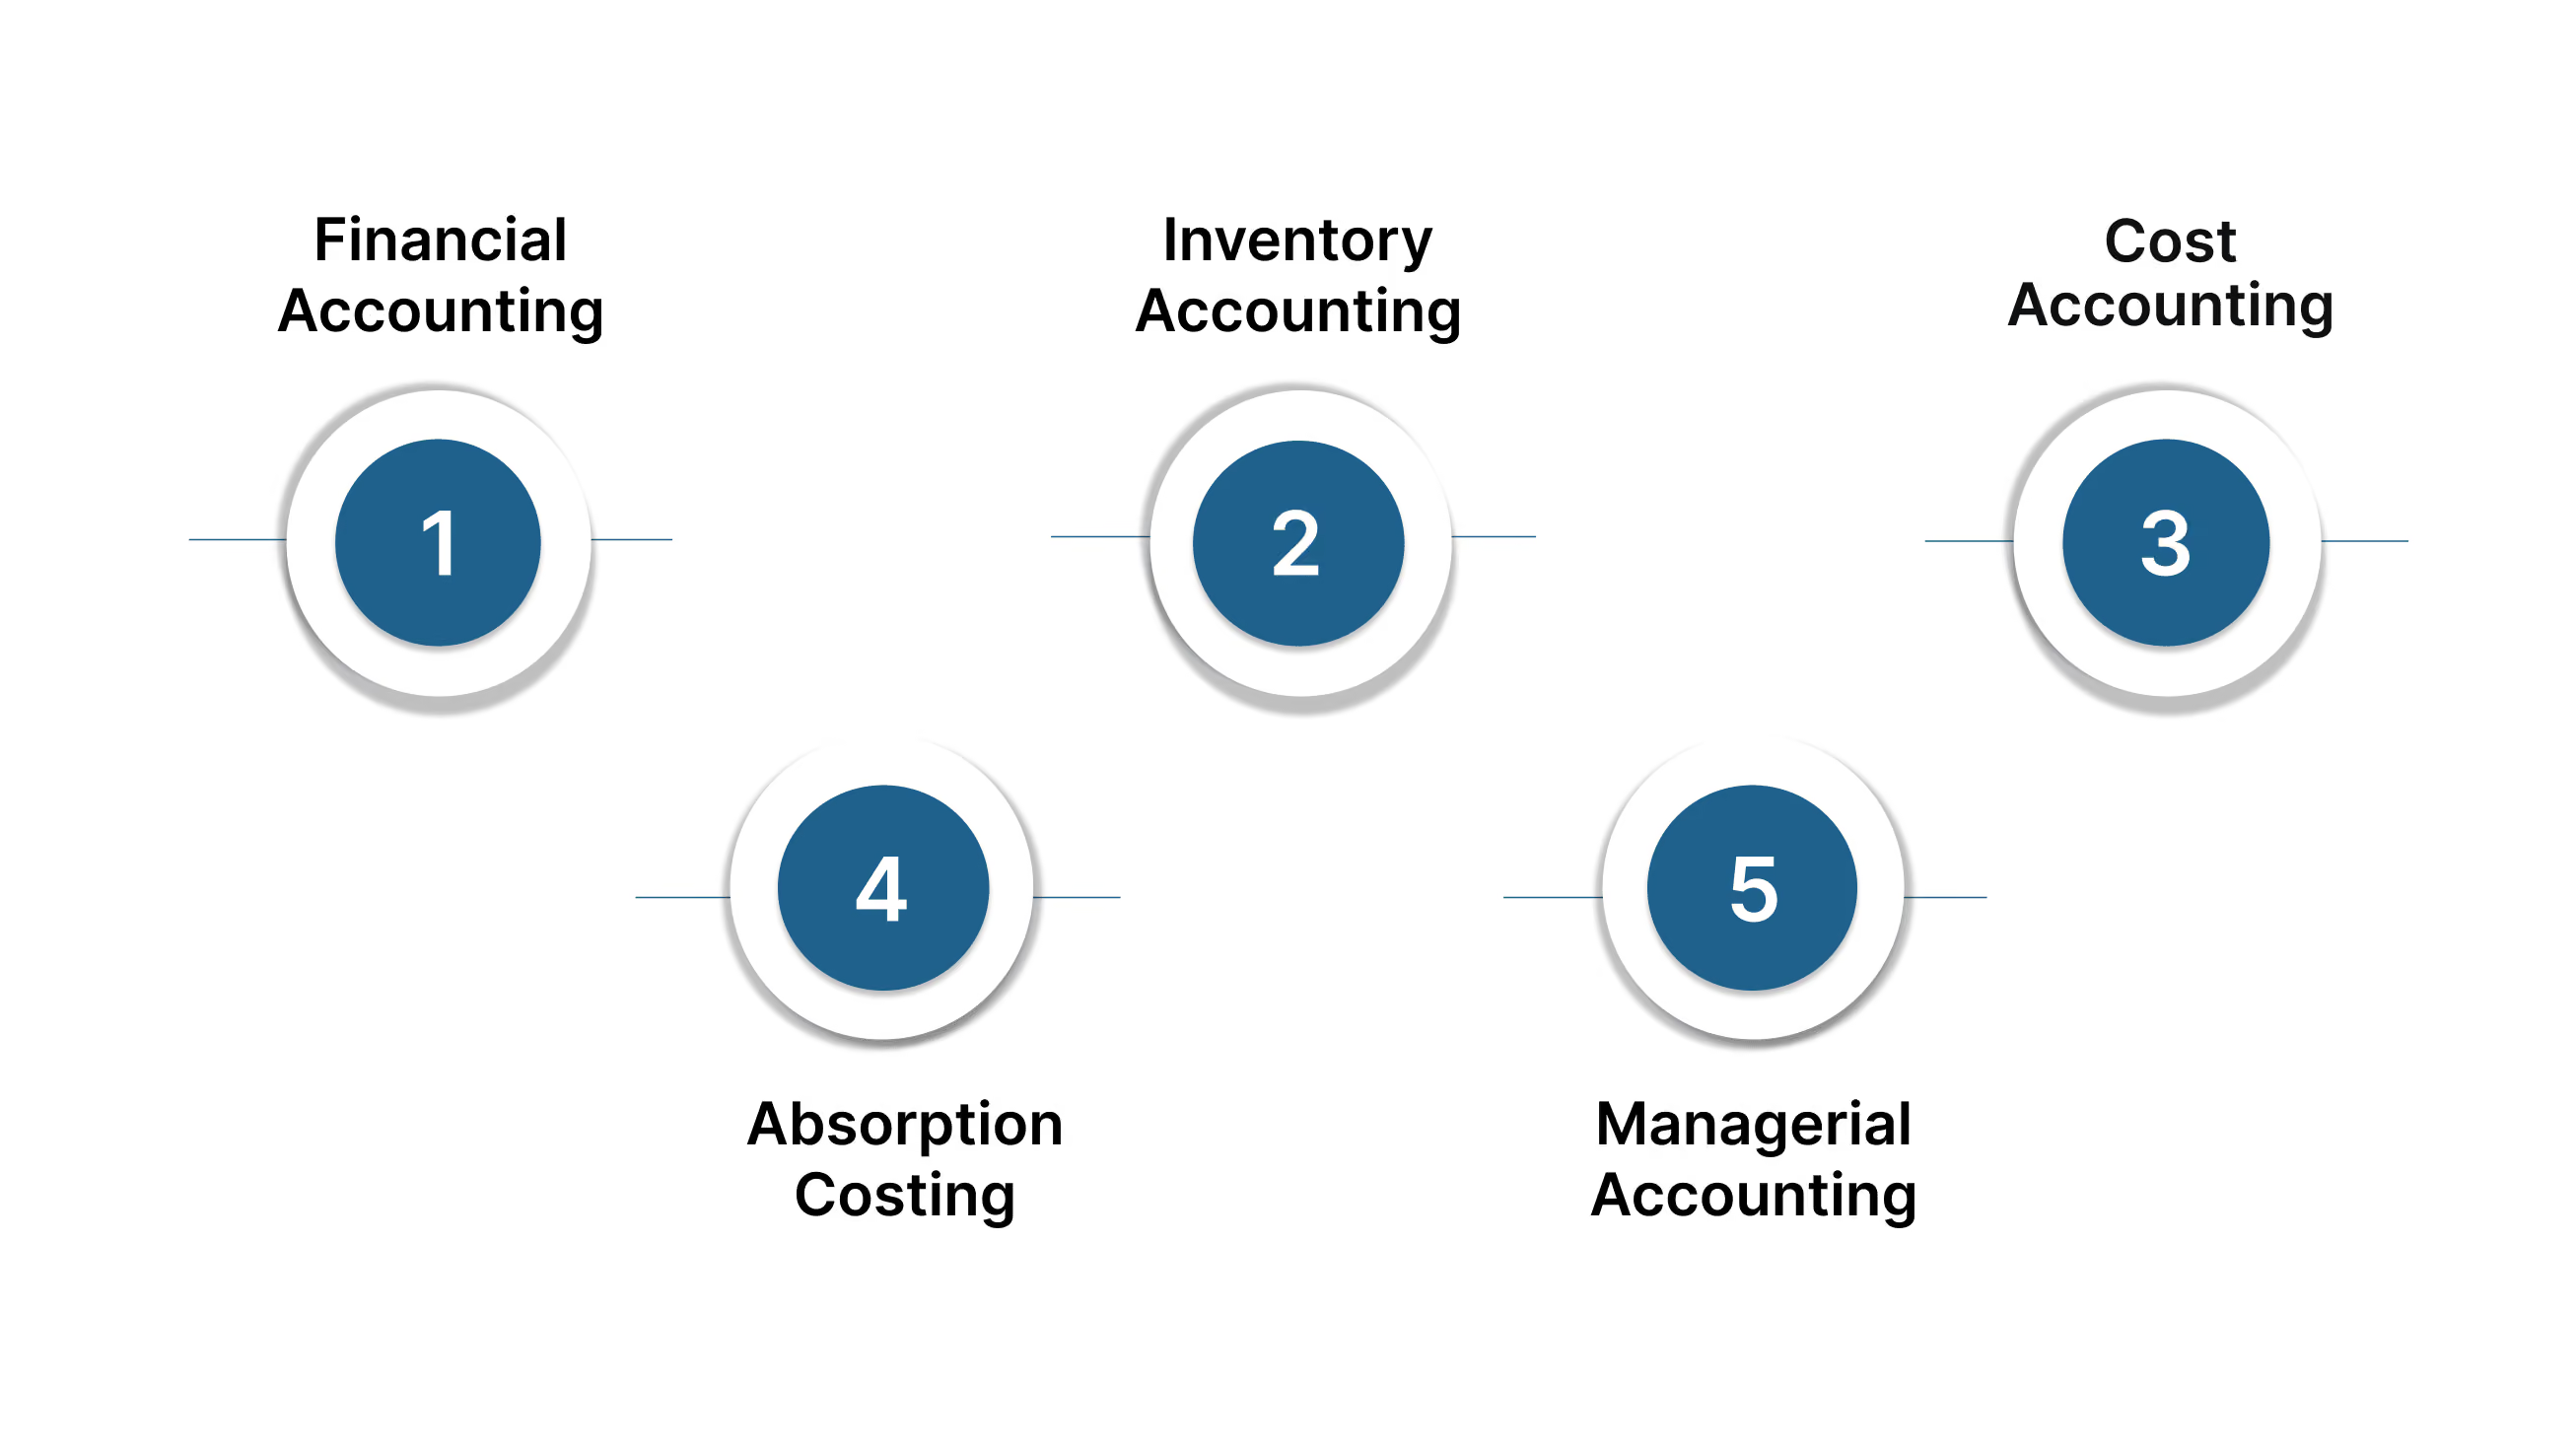
La fabricación utiliza una combinación de disciplinas contables que trabajan juntas desde la planta de producción hasta los estados financieros. Cada una responde a una pregunta diferente: cuánto costó fabricar, cómo debemos valorar el inventario y qué deben cambiar los líderes a continuación para mejorar los márgenes.
Esta es la prioridad para la presentación de informes externos. Los fabricantes estadounidenses siguen los US GAAP, mientras que las entidades indias siguen las Ind AS, que se basan en las NIIF (IFRS).
En ambos casos, el inventario se registra al coste y posteriormente se compara con el valor neto realizable. Los US GAAP permiten métodos como FIFO, promedio ponderado y LIFO. Las NIIF y las Ind AS prohíben el LIFO, por lo que los grupos transfronterizos deben elegir los métodos con cuidado al trabajar entre EE. UU. y la India.
Este tipo convierte la actividad de producción en cifras para el balance y el coste de los productos vendidos. Las empresas suelen utilizar FIFO o el coste promedio ponderado. Las NIIF y las Ind AS exigen el modelo del menor valor entre el coste y el valor neto realizable.
Los US GAAP utilizan un modelo similar, pero aplican una prueba de "mercado" diferente cuando se utilizan métodos LIFO o minoristas. Estas normas afectan a los márgenes y a los impuestos, por lo que la coherencia entre los libros contables de EE. UU. y la India es fundamental.
La contabilidad de costes es el motor principal. Captura los materiales directos, la mano de obra directa y los gastos generales de fabricación, y los asigna a las unidades producidas. Los fabricantes eligen los métodos en función de cómo fabrican sus productos. El costeo por órdenes de trabajo se adapta a los pedidos personalizados y a las tiradas cortas. El costeo por procesos se adapta a la producción continua y homogénea.
Muchas plantas también utilizan el costeo estándar con análisis de variaciones para detectar brechas entre los resultados previstos y los reales. El costeo basado en actividades ayuda a distribuir los gastos generales utilizando los impulsores de costes reales en lugar de promedios generales.
This costing is required for external financial statements. It puts all manufacturing costs into inventory, including fixed factory overhead. That keeps reporting comparable and ties cost to revenue when goods are sold. Managers often review variable costing internally to see contribution margins and short-run decisions more clearly, but they still publish absorption-based results.
Managerial pulls the above into plans and decisions. Teams use cost and inventory data to set prices, budget materials and labour, monitor capacity, and evaluate product line profitability.
When a company operates from the US to India, managerial reports also reconcile method differences across GAAP, IFRS, and Ind AS so leaders see one version of the truth for unit cost, margins, and cash tied up in stock.
Put together, these disciplines give manufacturers a full view of performance. Financial accounting keeps you compliant. Inventory and absorption rules keep statements consistent. Cost and managerial tools help you reduce waste, set prices with confidence, and plan production with fewer surprises.
VJM Global brings expertise in U.S. GAAP, IFRS, and Ind AS, helping cross-border manufacturers maintain consistency in cost reporting and financial compliance across both jurisdictions.
Each of these accounting types plays a role in measuring production performance. But before we can calculate profits or value inventory, we need to understand the building blocks: the main cost components that make up total manufacturing expense.
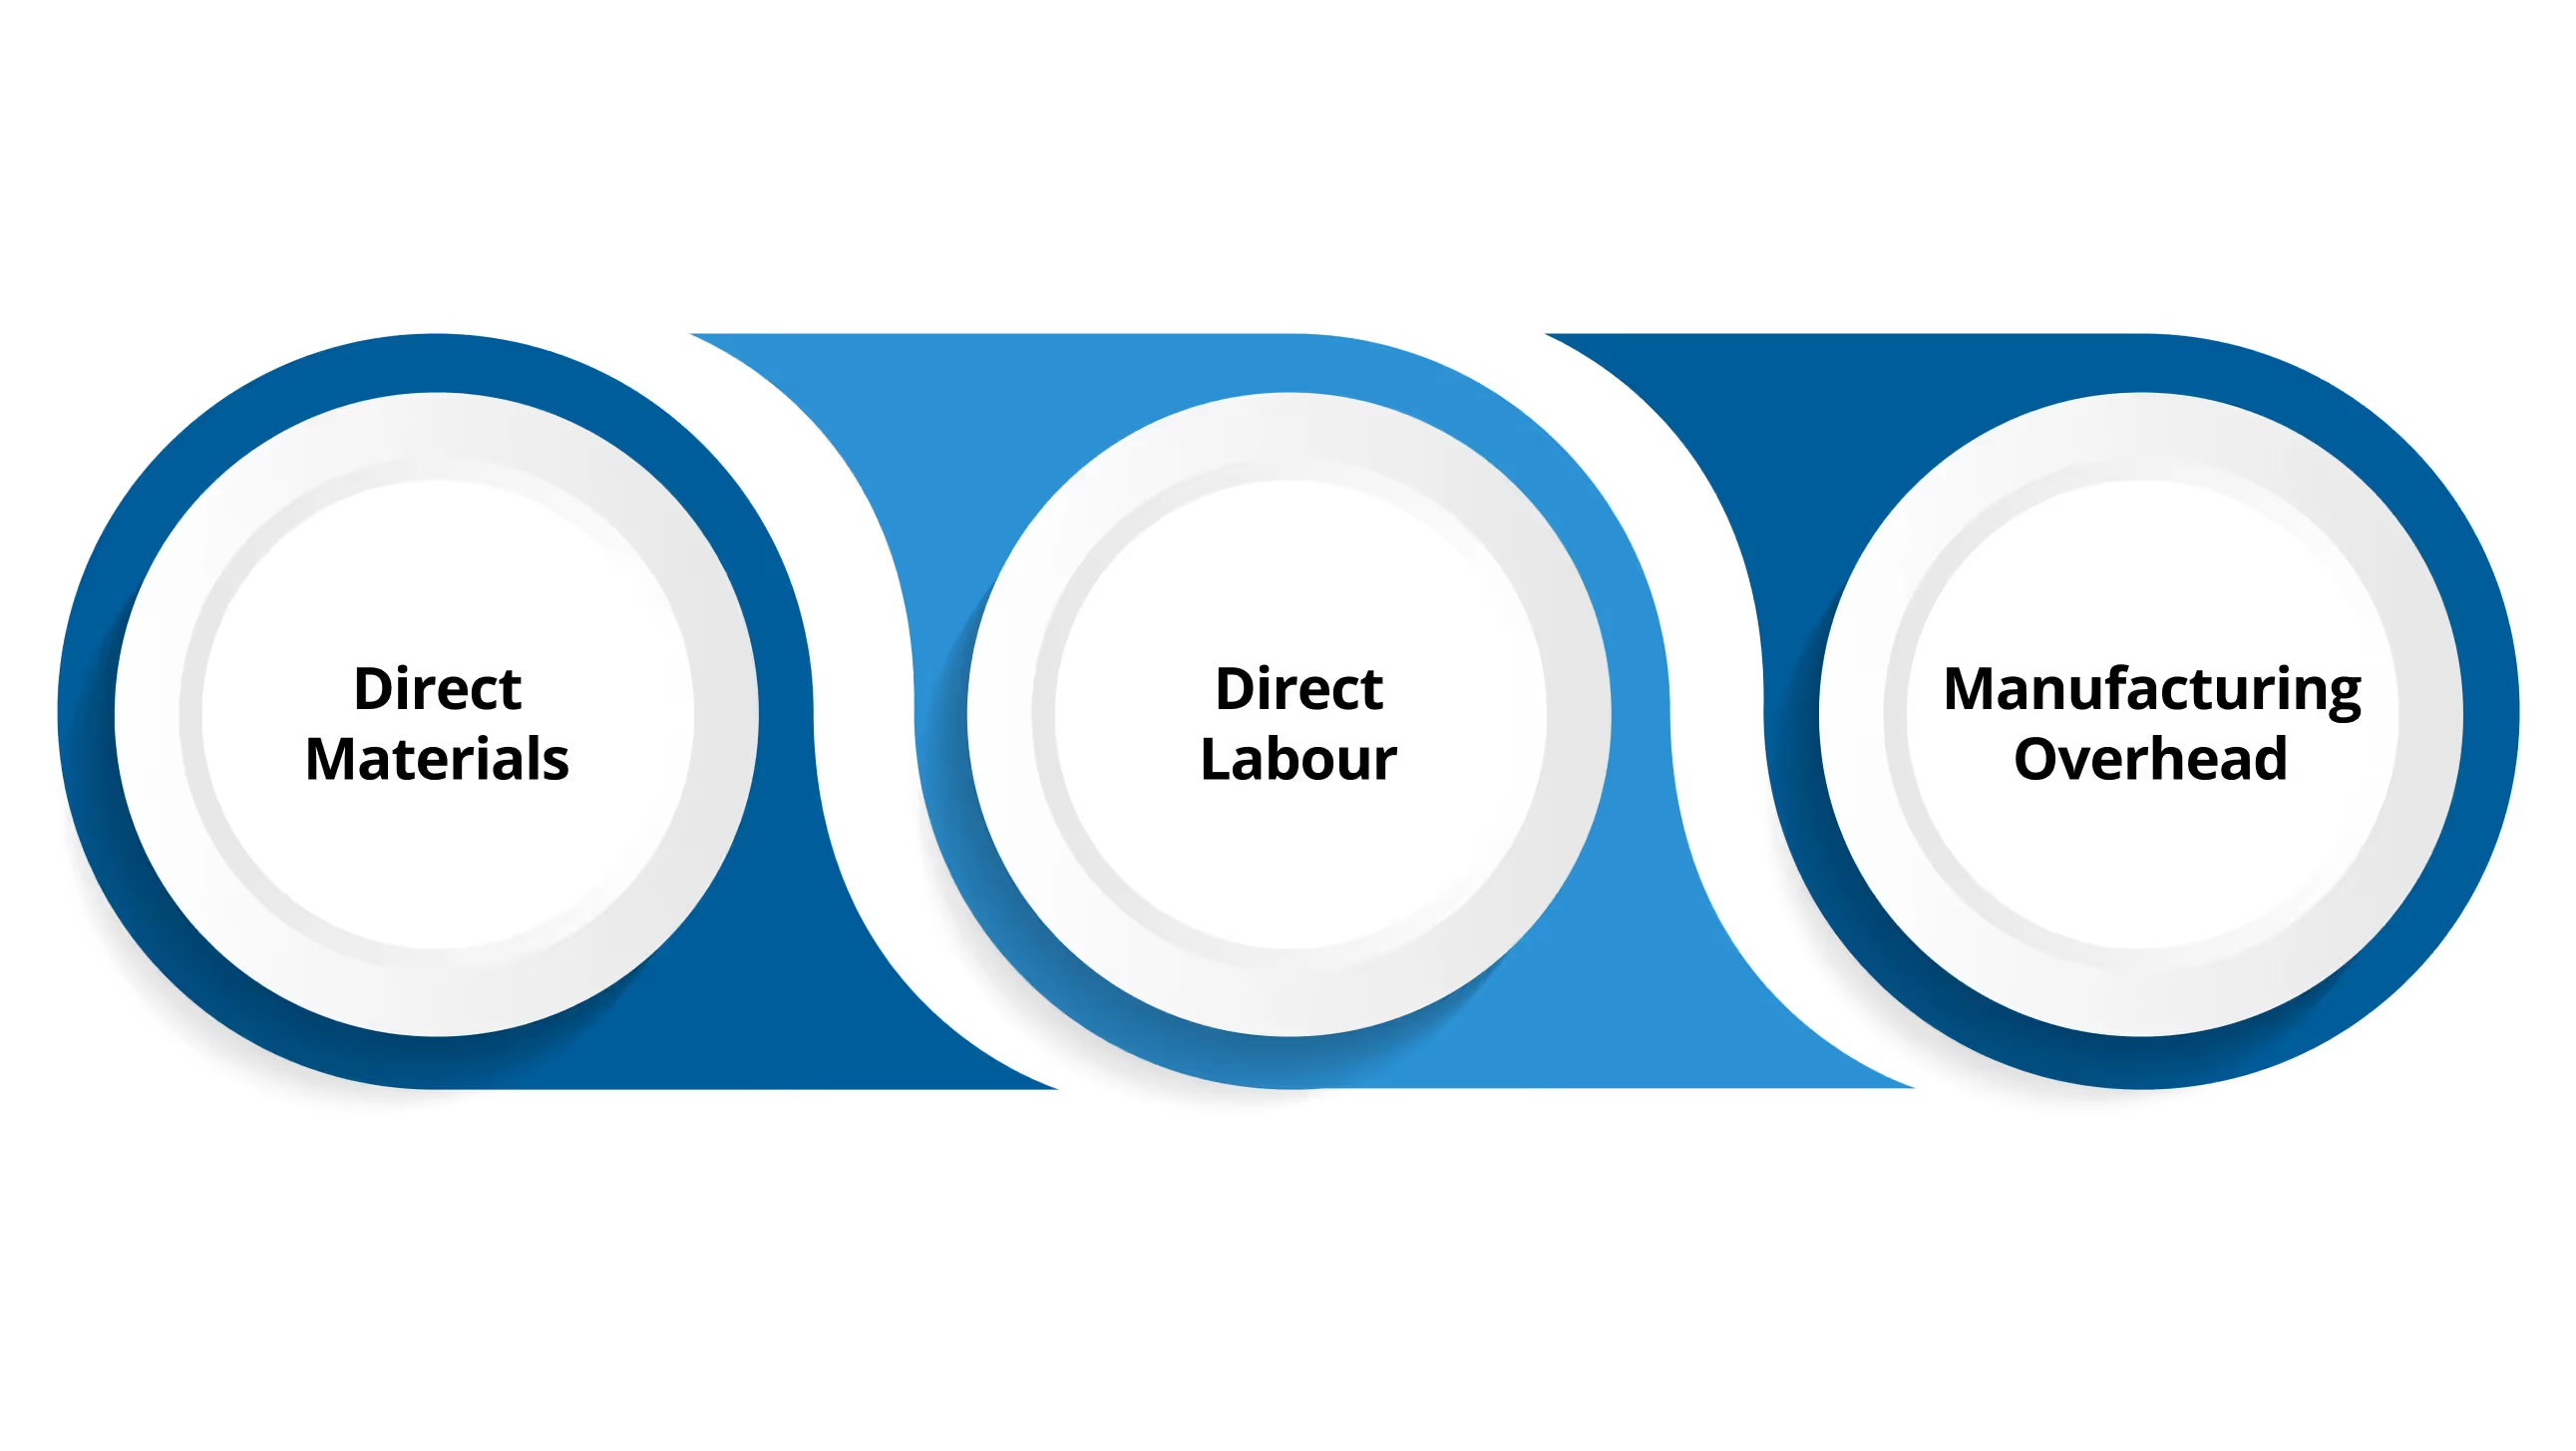
Manufacturing relies on a mix of accounting disciplines that work together to turn shop-floor activity into clear financial insight. Here are the core types and how they fit:
These three together are often called product costs because they are capitalised into inventory and later flow into COGS when you sell the goods. Selling and administrative costs sit outside manufacturing and are treated as period costs, expensed in the period incurred. Keeping the line clear between product and period costs is a basic control that protects reported profit.
You will also hear two helpful summaries:
Costs behave differently as output rises or falls, so it helps to group them by behavior:
Finally, tie costs to where goods sit in the flow. Raw materials await use, work in progress (WIP) holds partially completed items carrying materials, labor, and overhead, and finished goods are sale-ready. Accurate moves between these stages keep your balance sheet clean and your COGS trustworthy.
If your operations run from the US to India, align definitions and valuation rules on both sides so reports match and decisions stay consistent.
Suggested read: How to Claim R&D Tax Credits for Manufacturing: Outsource to India from the US
When these costs are identified and grouped correctly, manufacturers can translate them into measurable outputs. The next logical step is to see how these costs flow through the production process, from raw material to finished goods, by calculating the cost of goods manufactured and the cost of goods sold.
For manufacturers, understanding two key figures, Cost of Goods Manufactured (COGM) and Cost of Goods Sold (COGS), is vital. These numbers tie what happens on the production floor into your financial statements, and they are particularly important if your operations span geographical locations from the US to India.
COGM captures the total cost incurred to produce finished goods during a period, regardless of whether those goods have been sold yet. It bundles up direct materials, direct labour and manufacturing overhead, adds beginning work-in-progress (WIP) inventory, and subtracts ending WIP inventory.
A standard formula is:
COGM = Beginning WIP Inventory + Total Manufacturing Costs – Ending WIP Inventory
Where Total Manufacturing Costs = Direct Materials + Direct Labour + Manufacturing Overhead.
Por qué es importante:
COGS reflects the cost of finished goods that were sold during the period. It connects manufacturing cost to revenue and appears directly on the income statement.
A typical formula for manufacturers is:
COGS = Beginning Finished Goods Inventory + COGM – Ending Finished Goods Inventory
This aligns with a broader view of inventory flow: beginning inventory plus what was manufactured (COGM) gives goods available for sale; subtract ending inventory and you get what was actually sold.
Por qué es importante:
To compute these effectively, you’ll need:
Also read: Understanding GAAP vs. Non-GAAP Gross Margin: Why Companies Outsource from the US to India
Knowing your COGM and COGS gives you a clear picture of profitability. But how you assign value to your inventory along the way can change those results significantly. That’s why the next section focuses on inventory costing methods and how to choose the right one for your business.
Inventory is the heartbeat of any manufacturing business. How you value it determines your cost of goods sold (COGS), gross profit, and ultimately, how healthy your balance sheet looks:
FIFO assumes the oldest inventory items are sold first. The cost of older materials moves to COGS, while newer purchases remain in ending inventory. In times of rising material prices, FIFO shows lower COGS and higher profits because cheaper, earlier costs are matched against current sales. It’s widely accepted under both US GAAP and Ind AS/IFRS, making it a practical choice for manufacturers operating across both markets.
LIFO assumes the most recently purchased goods are sold first. It matches current costs with current revenue and can reduce taxable income when prices rise. However, LIFO is allowed under US GAAP but prohibited under IFRS and Ind AS, so multinational manufacturers from the US to India must maintain reconciliation between LIFO books in the US and FIFO or weighted-average books in India.
The weighted-average method smooths price fluctuations by averaging total cost of goods available for sale over total units. Each unit in inventory carries the same average cost. It’s simple to maintain in automated systems and is accepted under both US GAAP and Ind AS/IFRS. Many Indian manufacturers prefer this method for its stability when raw-material prices change frequently.
This method traces the exact cost of each unique item, making it suitable for high-value or custom-made goods, such as machinery or luxury components. It provides the most precise matching of cost and revenue but requires detailed tracking and is rarely used in high-volume manufacturing.
Standard costing sets predetermined costs for materials, labour, and overhead, and records differences as variances. It’s often combined with other methods for internal control and performance monitoring. Variances, favourable or unfavourable, help managers evaluate efficiency and take corrective action.
ABC allocates overheads using actual activities, machine hours, quality checks, or batch setups, rather than broad averages. It offers a clearer picture of true production cost, especially in complex or multi-product environments. For cross-border manufacturers from the US to India, ABC supports better transfer-pricing documentation by linking costs to specific operational drivers.
The best costing method depends on your production type, price volatility, and reporting obligations. A U.S. firm manufacturing in India might maintain FIFO or weighted-average in Indian books for Ind AS compliance, while keeping LIFO for U.S. tax purposes. Consistency and disclosure are key. When reporting consolidated results, adjustments ensure inventory valuation aligns with group policy.
At VJM Global, we advise manufacturers on selecting and applying the right inventory-costing method, whether FIFO, weighted average, or standard costing, to keep valuations consistent and transparent across entities.
Costing is only one part of the financial picture. To turn cost data into decisions, manufacturers need tools that link production, volume, and profitability, which brings us to cost-volume-profit (CVP) analysis and why it matters for strategic planning.
Cost-Volume-Profit (CVP) analysis is a simple but powerful way to understand how costs, sales volume, and profits relate to each other. It helps manufacturers answer one of the most practical questions in business: how many units do we need to sell to cover our costs, and how much profit will we earn beyond that point?
The formula is straightforward:
Break-even point (in units) = Fixed Costs ÷ (Selling Price per Unit – Variable Cost per Unit)
Once you cross this point, each additional unit sold increases profit by the contribution margin.
Manufacturers often face trade-offs, whether to automate a process, outsource a component, or expand production capacity. CVP analysis highlights how each decision changes the cost mix. For instance, automating might increase fixed costs but lower variable costs per unit, shifting the break-even point. It also helps forecast the impact of currency changes or raw material fluctuations for firms operating from the US to India.
Managers use CVP models to:
While CVP analysis helps guide decisions, sound accounting practices keep the entire system reliable. Let’s close by reviewing best practices that strengthen manufacturing accounting and maintain consistency across operations in different regions.
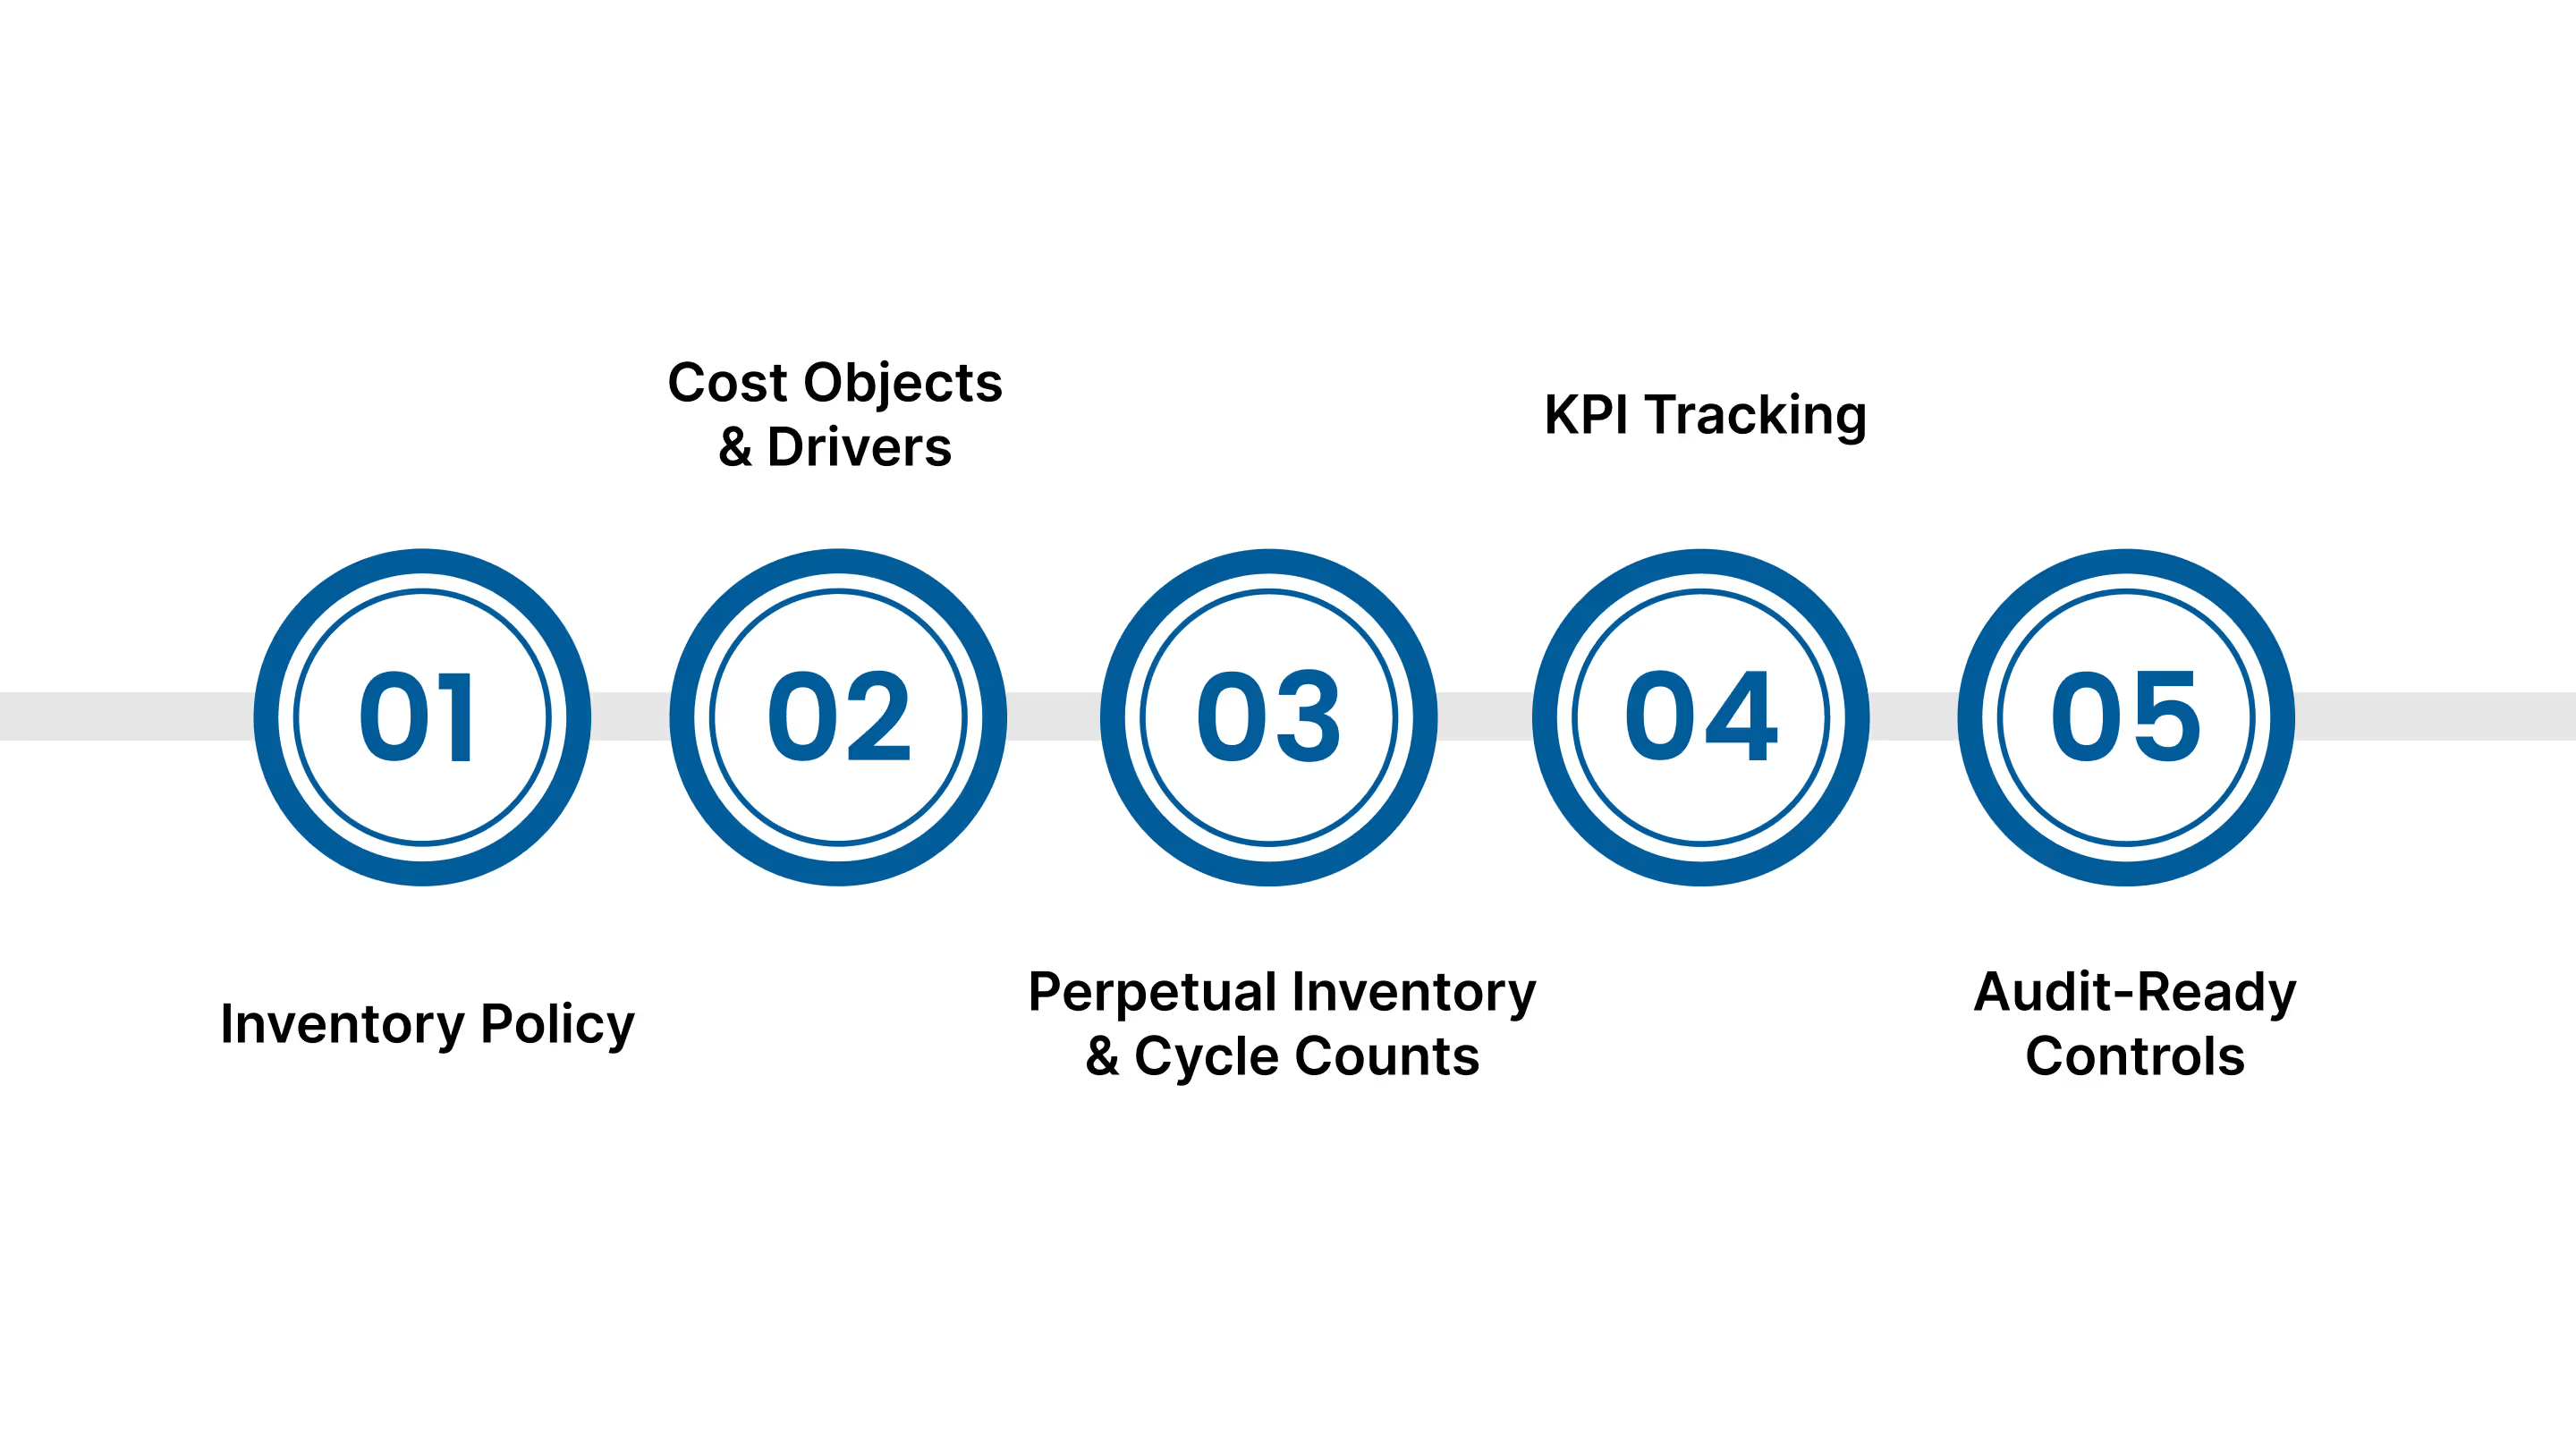
Strong manufacturing accounting starts with simple rules you follow every month. The goal is clear numbers you can trust for pricing, planning, and audits, especially if your operations run from the US to India.
Pick your cost formula and valuation rules, write them down, and apply them the same way every period. Under IFRS/Ind AS, inventories are measured at the lower of cost and net realisable value.
Under US GAAP, most inventories are measured at the lower of cost or market or, for many entities, the lower of cost and NRV under recent guidance. If your US books use LIFO while India uses FIFO or weighted average, build a reconciliation so group results stay consistent.
Decide what you are costing, a product, batch, line, or customer, and choose drivers that reflect real work, such as machine hours or setups.
Consider activity-based costing when overhead is material or products differ widely in how they consume resources. Document the model so plant, finance, and audit teams are using the same map.
Physical counts once a year are not enough for fast-moving plants. Use cycle counting to test small portions of stock frequently, reconcile differences, and fix root causes.
A perpetual system plus cycle counts improves record accuracy and supports reliable financial reporting. Government and industry guidance view cycle counting as a leading practice for control and efficiency.
Monitor inventory turns for raw materials, WIP, and finished goods. Use trends to spot slow-moving items, bottlenecks, or data issues. Turnover is a simple ratio, but it is one of the best signals for cash tied up in stock and for COGS accuracy.
Limit who can add items, change costs, or post adjustments. Separate duties for purchasing, receiving, and recording. Map these controls to the COSO framework so you can show management and auditors how risks are addressed in day-to-day work.
Maintain bills of materials, routing standards, variance analyses, overhead pools, and count sheets with sign-offs. If a service provider handles accounting tasks, ask for relevant SOC assurance reports to gain comfort over their controls.
Create a monthly checklist that moves cleanly from shop-floor data to the ledger: materials issues, labour capture, overhead application, WIP roll-forward, COGM and COGS calculations, then reconciliations to inventory subledgers.
If you operate from the US to India, include currency translation steps and a standing reconciliation for any GAAP vs Ind AS differences referenced in your policy.
Good manufacturing accounting does three things. It shows what each unit truly costs, it keeps inventory values credible, and it helps leaders choose where to improve. The methods you pick for costing and inventory, and the way you apply them month after month, will shape pricing, capacity plans, and gross margin. When plants, suppliers, or finance teams sit in different countries, the need for common rules and clean handoffs grows. That is how you avoid surprises at close and keep cash, cost, and output in balance.
If you want a partner that understands cost accounting on the factory floor and statutory reporting at consolidation, talk to VJM Global. Our team supports inventory valuation, COGM and COGS builds, audit-ready workpapers, and cross-border reporting, including projects from the US to India.
Contáctenos hoy mismo para analizar su proceso y obtener un plan práctico que se adapte a sus sistemas y plazos.
Most manufacturers review standard costs quarterly or semi-annually, but high-volume plants often recheck material and labour rates monthly to capture price and efficiency changes promptly.
Modern ERP s
ystems integrate production data, inventory tracking, and accounting modules, reducing manual errors and ensuring real-time cost visibility across departments.
Improper overhead allocation can distort product costs, misstate inventory values, and lead to pricing errors. Regular variance analysis and periodic recalibration of cost drivers help prevent this issue.
Proporciona información sobre el comportamiento de los costos, la rentabilidad de los productos y el uso de la capacidad, datos que ayudan a los gerentes a decidir sobre precios, mejoras de procesos y prioridades de inversión.