
Businesses often extend credit to clients as part of their sales strategy. They allow payment delays, issue invoices periodically, and receive funds after delivery. This structure fosters customer trust, supports long-term relationships, and promotes revenue continuity.
But it also introduces risk. Delayed payments strain cash flow and challenge operations. To manage this balance between trust and liquidity, companies need a reliable financial gauge. The accounts receivable turnover ratio provides that lens.
It measures how frequently a company collects its outstanding credit sales within a set period. This reveals operational health, highlights the efficiency of collection efforts, and reflects the strength of credit policies.
This article explains the accounts receivable turnover ratio formula, walks through practical examples, and shows how to interpret and improve it. You'll also learn how to convert the ratio into collection days and understand its limitations.
So, let’s dive right into the article.
The Accounts Receivable Turnover Ratio is a key financial metric used to measure how efficiently a company collects its receivables or outstanding debts from customers. In simpler terms, it tells you how many times a company’s accounts receivable are collected and converted into cash during a specific period, usually a year.
This metric acts as both a performance mirror and a risk signal. It can spotlight a well-run accounts receivable process or expose systemic inefficiencies. A business that regularly cycles through its receivables maintains momentum. It keeps cash flowing, shortens outstanding balances, and lowers the risk of bad debt.
In essence, the receivables turnover ratio blends speed with discipline. Companies that post strong turnover ratios often exhibit clear credit controls, proactive collection efforts, and sharper liquidity strategies.
Here's why it’s important:
So, how do we calculate the accounts receivable turnover ratio? Let us understand all about this in detail below.
This ratio measures how effectively a business collects its credit sales from customers. In simple terms, it shows how many times in a given period the company collects its average accounts receivable.
計算式:
The formula to calculate the ARTR is:
Accounts Receivable Turnover Ratio= Net Credit Sales / Average Accounts Receivable
Where:
Understanding this formula enables businesses to fine-tune credit policies, identify cash flow gaps, and benchmark performance against industry standards.
Now, let us understand how to calculate the average accounts receivable.
Average Accounts Receivable is the mean value of A/R over a specific period. It is usually used to assess your company’s collection trends and calculate key ratios, such as Accounts Receivable Turnover.
To calculate average accounts receivable, use the following formula:
Average Accounts Receivable = (Opening A/R + Closing A/R) / 2
Determine the Opening Accounts Receivable- The opening accounts receivable is the balance of accounts receivable at the start of the period. It is typically found on the business's balance sheet for the previous period.
Determine the Closing Accounts Receivable- The closing accounts receivable is the balance at the end of the period you are analyzing. It can be found in the balance sheet for the current period.
Let us understand this with the help of an example given below.
Let’s break down the calculation for a clearer understanding. Suppose a business generates $500,000 in net credit sales, and its opening accounts receivable balance is $60,000 while the closing balance is $40,000. In that case, we first calculate the average accounts receivable by adding the opening and closing balances and dividing by 2:
Average Accounts Receivable = ($60,000 + $40,000) / 2 = $50,000
Next, we calculate the Accounts Receivable Turnover ratio by dividing net credit sales by the average accounts receivable:
Accounts Receivable Turnover = $500,000 / $50,000 = 10
This means the business collects its receivables 10 times per year. A higher turnover ratio indicates better efficiency in collecting payments. Now, let us discuss what higher and lower turnover ratios mean and how they impact your business financially.
Understanding how quickly your business collects money from customers is key to maintaining a healthy cash flow. This is where the Accounts Receivable Turnover Ratio plays an important role. It shows how efficiently a company turns its credit sales into cash. In other words, it tells you how fast your customers are paying what they owe.
Interpreting the Ratio:
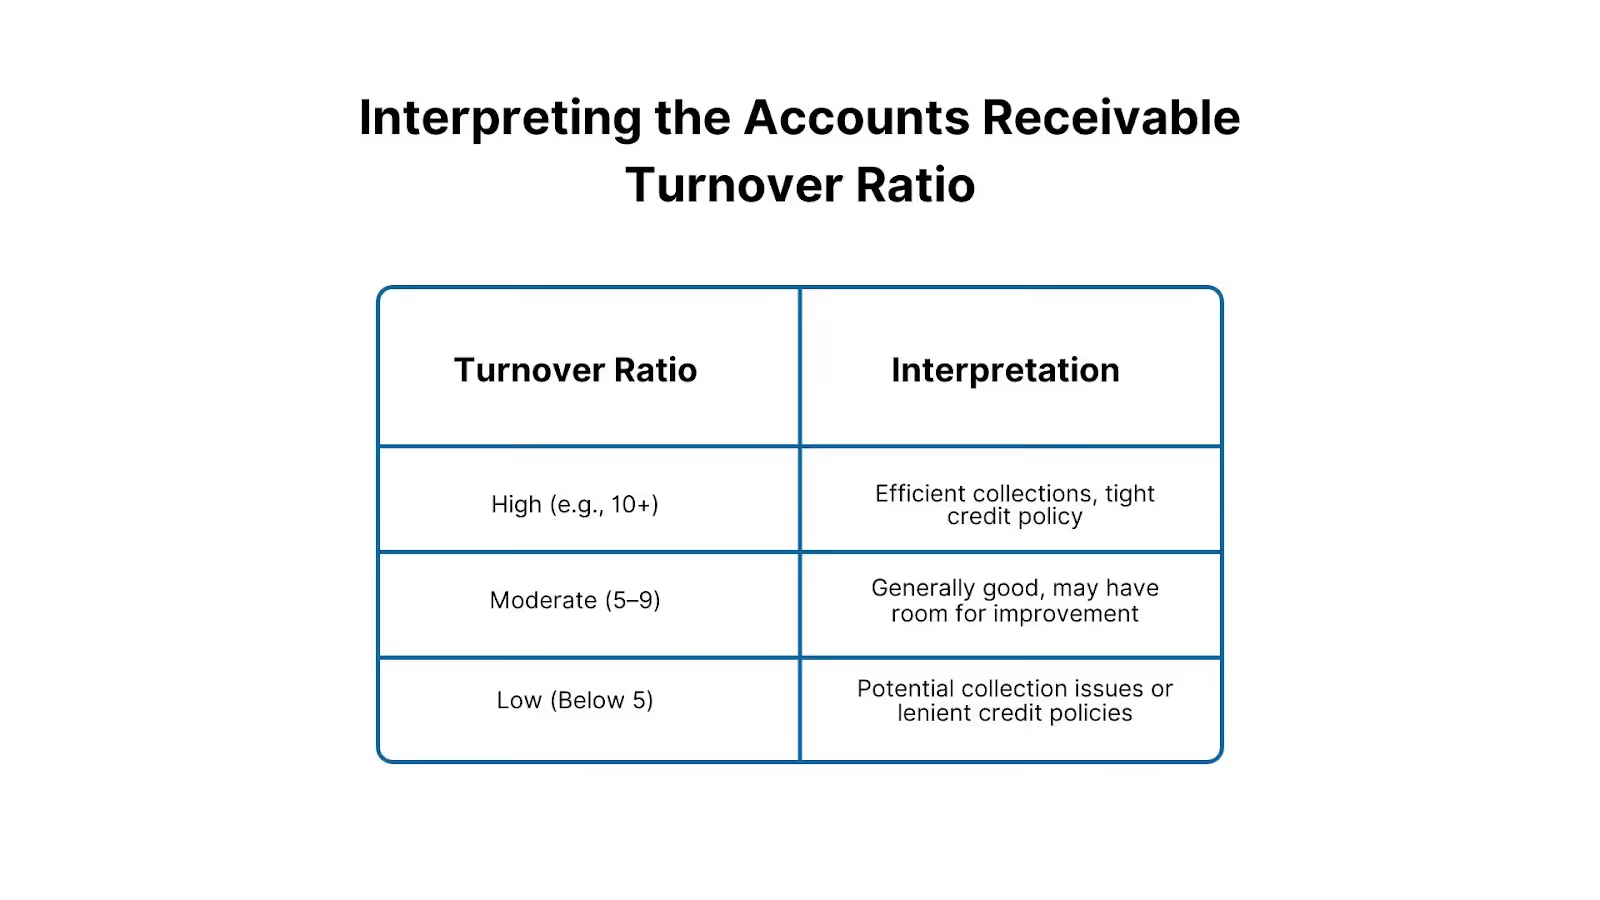
Let’s say a company has net credit sales of $500,000 and an average accounts receivable of $100,000.
Receivables Turnover = $500,000 / $100,000 = 5
This means the company collects its receivables 5 times a year, or roughly every 72 days (365 ÷ 5). Now, let us understand how to calculate accounts receivable turnover in days. Here’s how to do it.
Accounts Receivable Turnover in Days is a key financial metric that tells you how long it takes a business, on average, to collect payments from its customers after a sale is made. A shorter collection period generally indicates stronger cash flow and better liquidity.
It’s derived using the formula:
Receivable Turnover in Days = 365 / Accounts Receivable Turnover Ratio
Where the Accounts Receivable Turnover Ratio is:
Net Credit Sales / Average Accounts Receivable
If your Accounts Receivable Turnover Ratio is 10, then:
365 / 10 = 36.5 days
So, on average, it takes the business 36.5 days to collect payment.
For most companies, reducing this number is key to maintaining a healthy financial position. A shorter collection cycle means faster access to working capital, fewer resources tied up in receivables, and less risk of non-payment. Conversely, if this figure stretches too long, it may signal inefficiencies in the invoicing process, weak credit terms, or slow-paying customers.
Monitoring this metric over time can help identify trends, support improvements in credit policy, and drive better forecasting for cash flow management. VJM Global aids this by offering tailored financial advisory services, including tax strategies, audits, and restructuring. Our expertise provides businesses with crucial insights to strengthen financial health, optimize forecasting, and improve decision-making, ensuring better long-term financial management.
The Receivables Turnover Ratio measures how efficiently a company collects invoices, while the Asset Turnover Ratio evaluates how effectively all assets generate revenue. The former focuses on receivables, and the latter takes a broader view of asset efficiency, providing different insights into financial performance.
So, how can we improve the accounts receivable turnover ratio to ensure better financial discipline? Let's discuss this below.
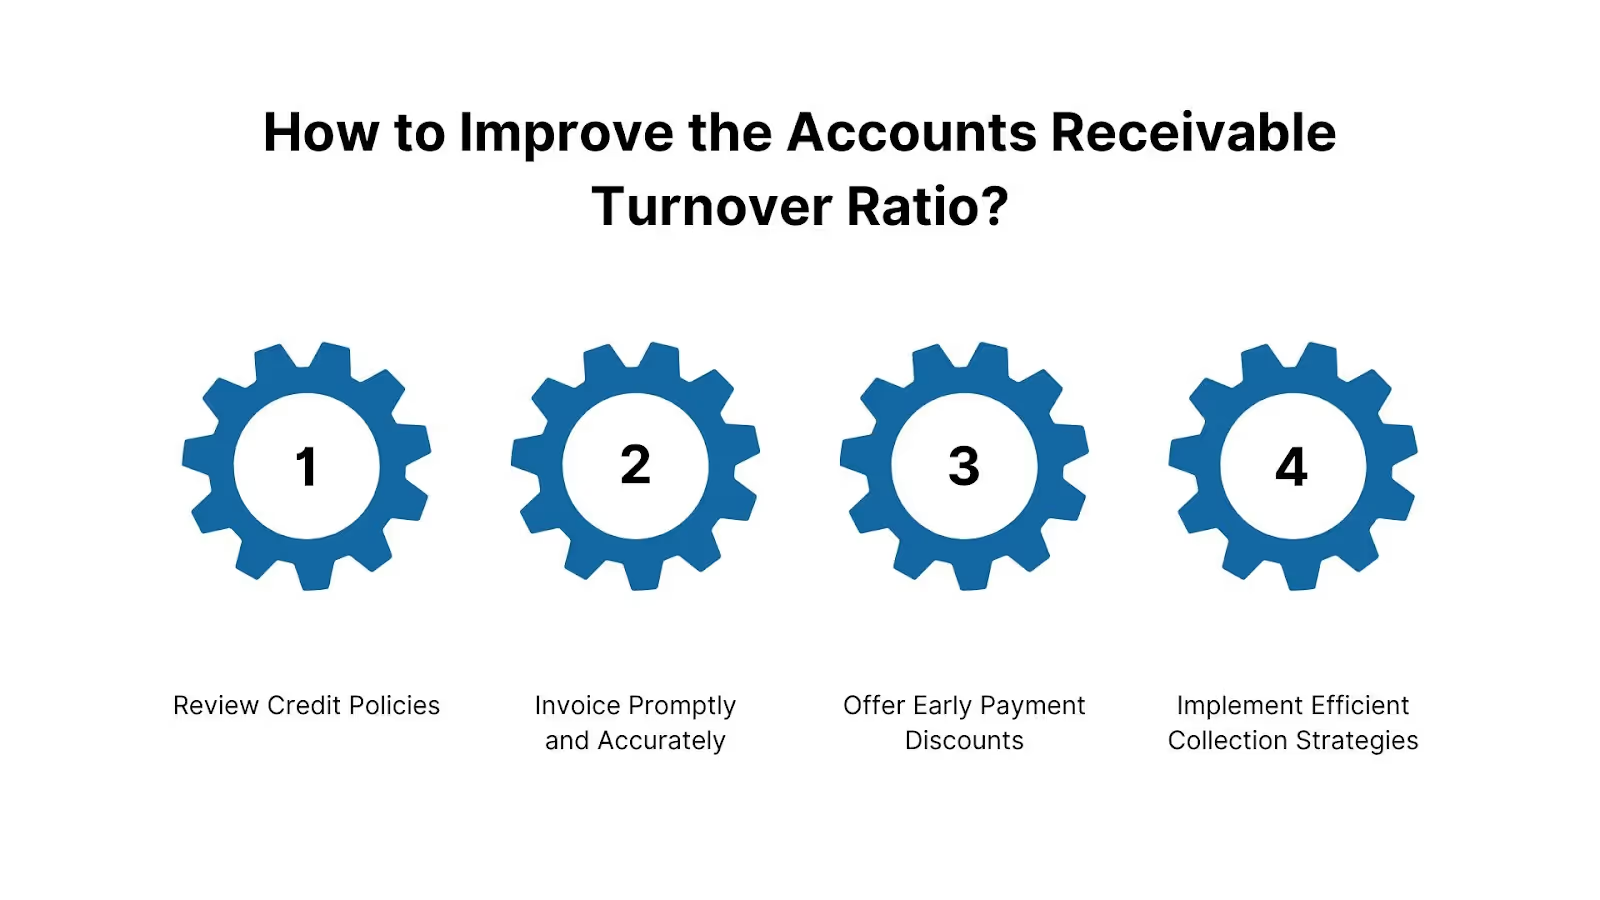
Improving your Accounts Receivable Turnover Ratio is essential for maintaining healthy cash flow and financial stability. Here are key strategies to help you collect receivables faster and more efficiently:
併せて読みたい: 外国企業が会計業務をアウトソーシングするメリット
For U.S.-based businesses and CPA firms, managing receivables can become resource-intensive, especially with limited in-house staff or high operational costs. That’s where VJM Global steps in. Our team handles everything from timely invoicing and AR aging report reviews to payment tracking and customer follow-ups, all through cloud platforms like QuickBooks, Xero, and Gusto. With strong internal controls, familiarity with U.S. compliance norms, and efficient offshore workflows, VJM Global helps companies:
次に、売上債権回転率の限界について解説します。
売上債権回転率は、企業が顧客からどれだけ効率的に代金を回収できているかを示す有用な指標ですが、いくつかの限界があります。
売上債権回転率(ARTR)を効果的に管理することは、健全なキャッシュフローを維持するために不可欠です。この比率は、企業が未回収の代金をどれだけ効率的に回収できているかを示すものであり、企業の財務安定性に直結します。
VJM Globalは、AR(売掛金)プロセスを合理化し、未回収債権を削減して流動性を向上させるための専門的なソリューションと戦略を提供します。これにより、企業の売上債権回転率を高め、より強固な財務成長を実現します。
VJM Globalの包括的なAR管理アプローチは、貴社の債権プロセスを、財務の安定性と成長を促進する強力なツールへと変革します。
今すぐコンサルティングをご予約ください。売上債権(AR)回転率を向上させ、キャッシュフローを最適化する方法をご提案します。

.avif)